Lab 1.1: Introduction to the Elastic Stack
Objective:
In this lab, you will index some sample data that ships with Kibana and view some of the other features of using Kibana.
-
Your lab environment has a 3-node Elasticsearch cluster already up and running, along with a Kibana instance connected to the cluster. You can access this Kibana instance by clicking the Kibana1 button in your Strigo lab environment toolbar. Log in to Kibana using
trainingfor the username andnonprodpwdfor the password. -
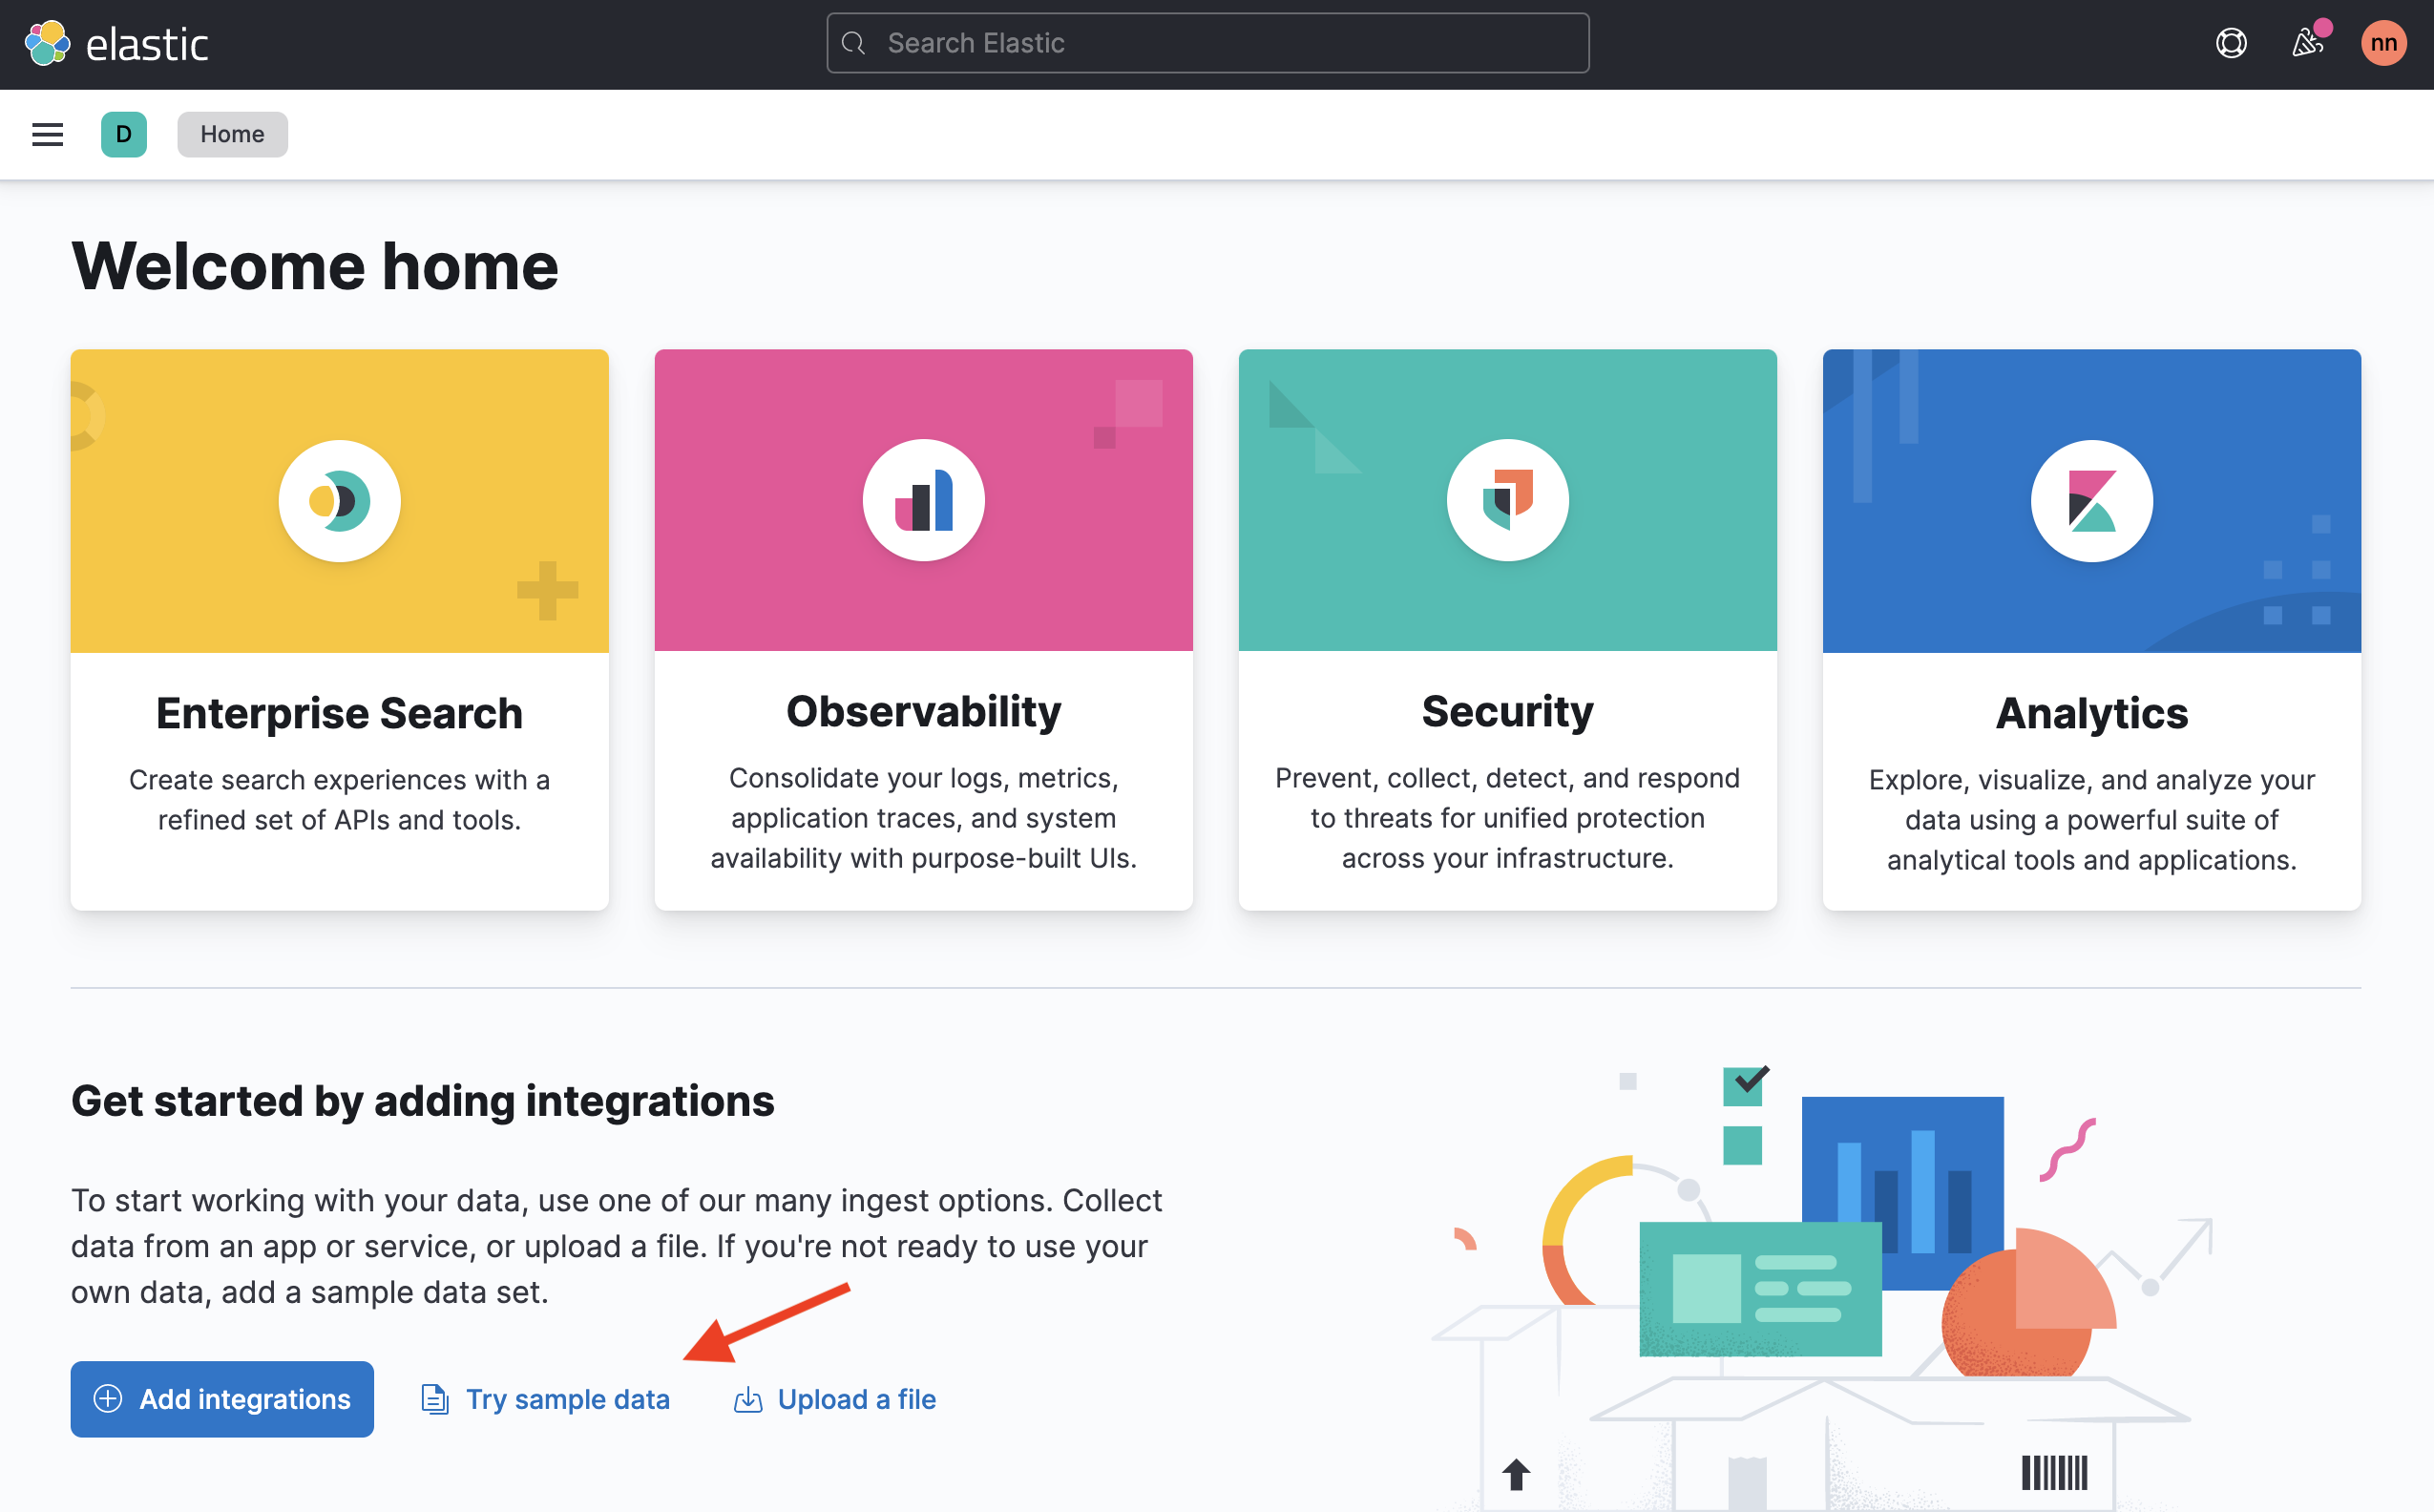
From the Home page of Kibana, click the Try sample data link:
-
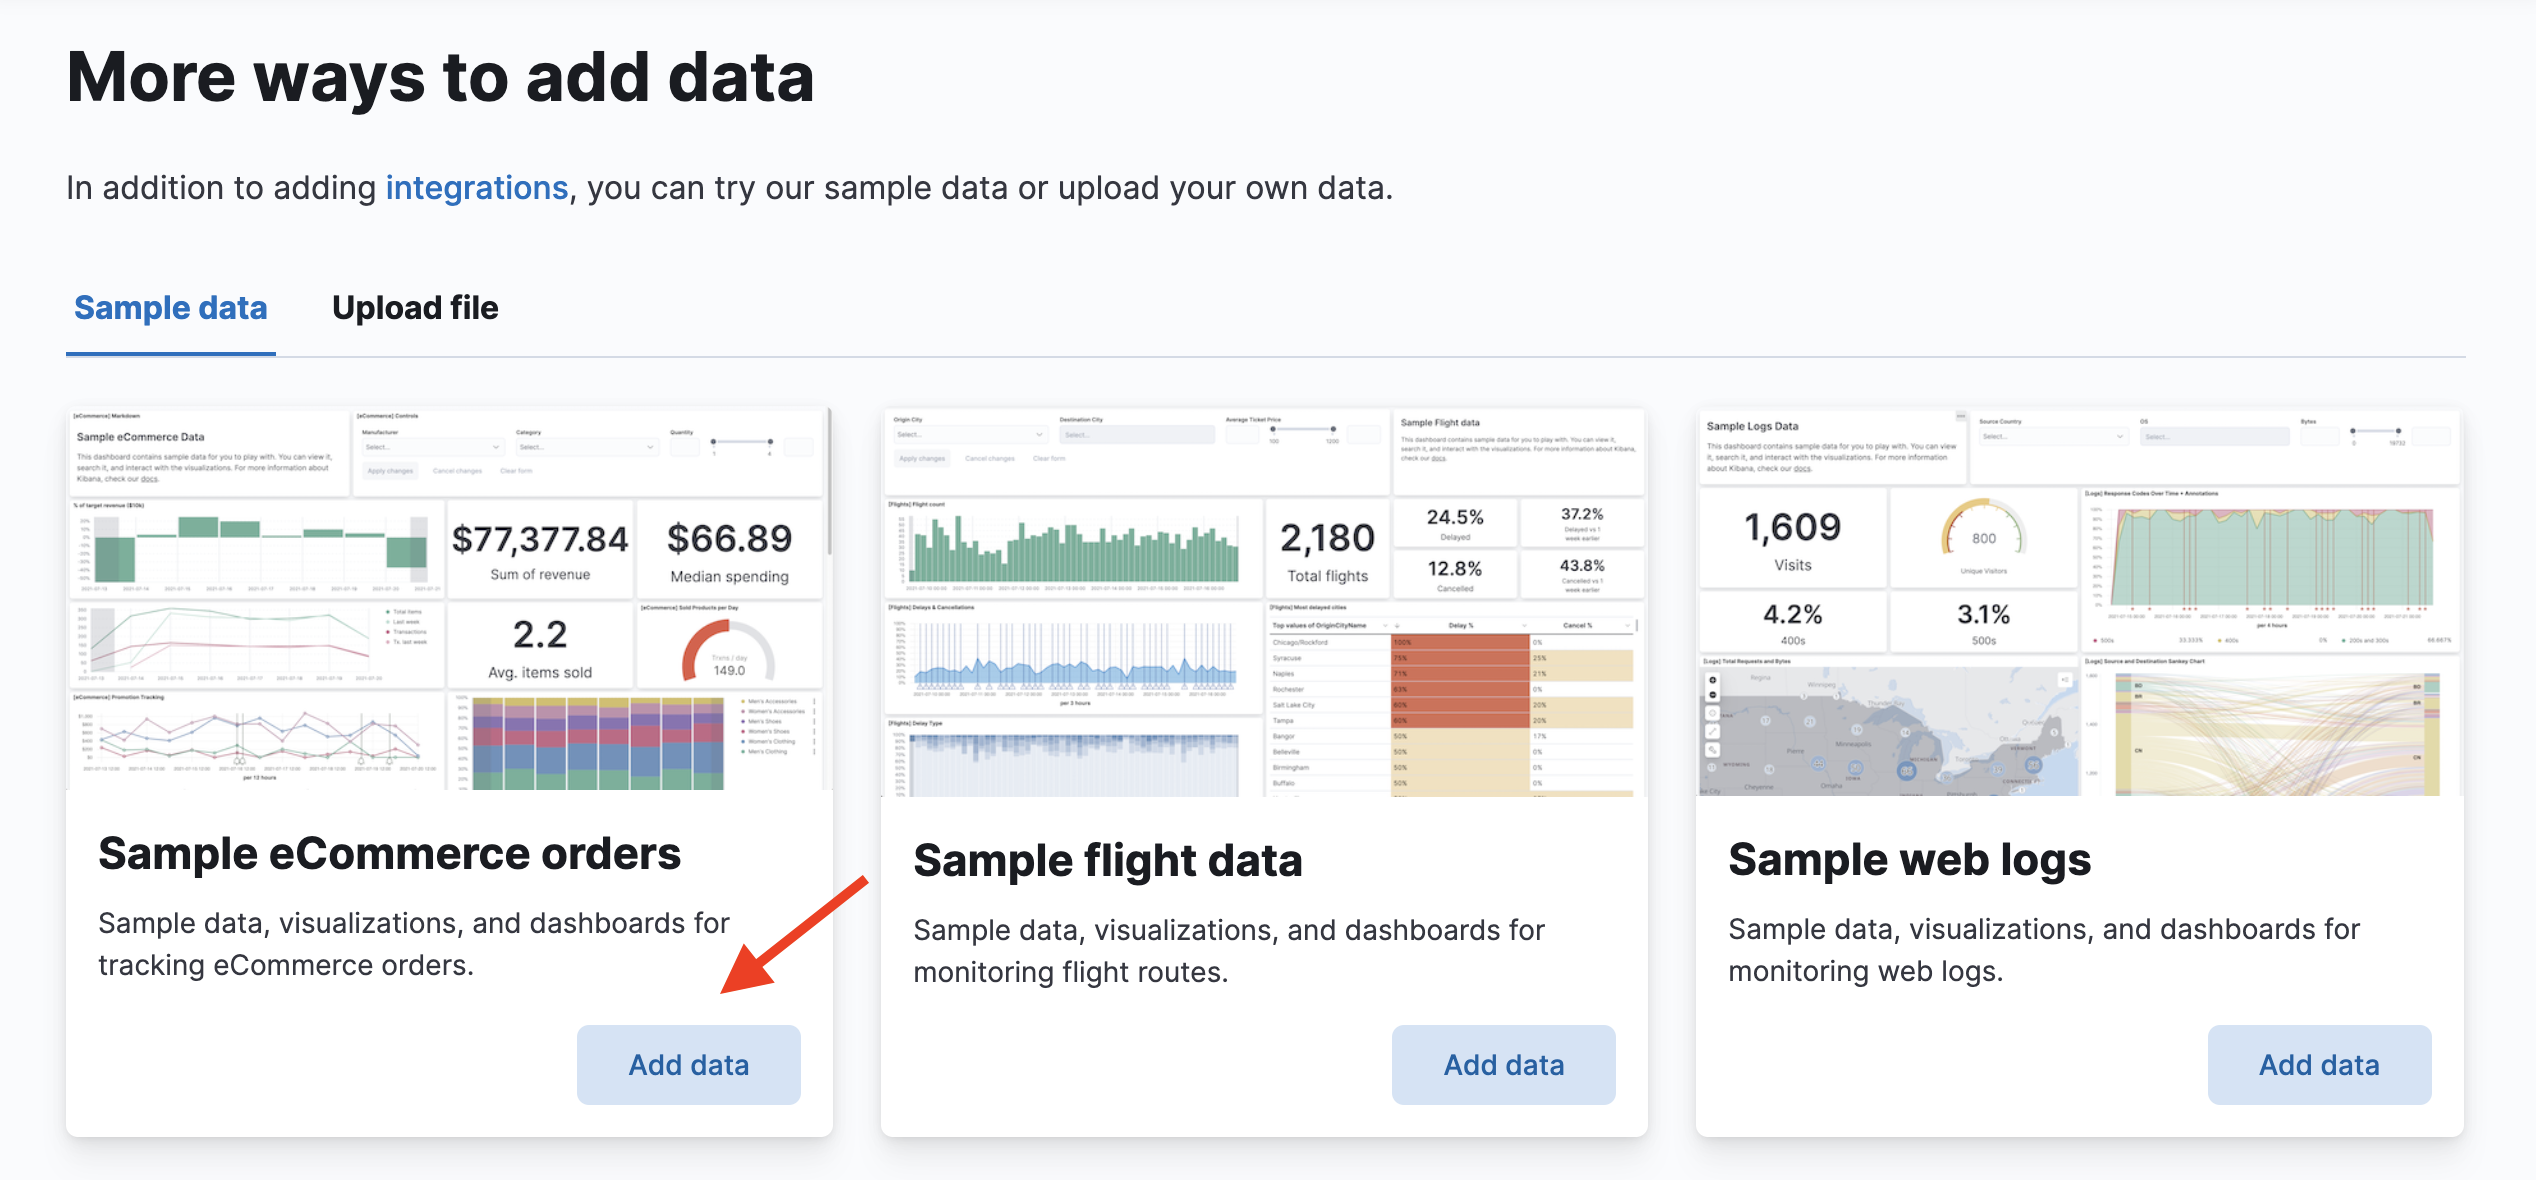
Add the Sample eCommerce orders dataset by clicking its Add data button:
-
To view your newly-indexed data, access the Discover in Kibana. Open Kibana's main menu by clicking the menu button in the top-left. Select Discover under the Analytics heading.
-
Discover shows you the volume of documents being indexed, along with a table displaying recently added documents. Notice you are viewing the Last 15 minutes of data, as shown in the Kibana time filter. Click on the calendar icon in the time filter and select Last 24 hours:
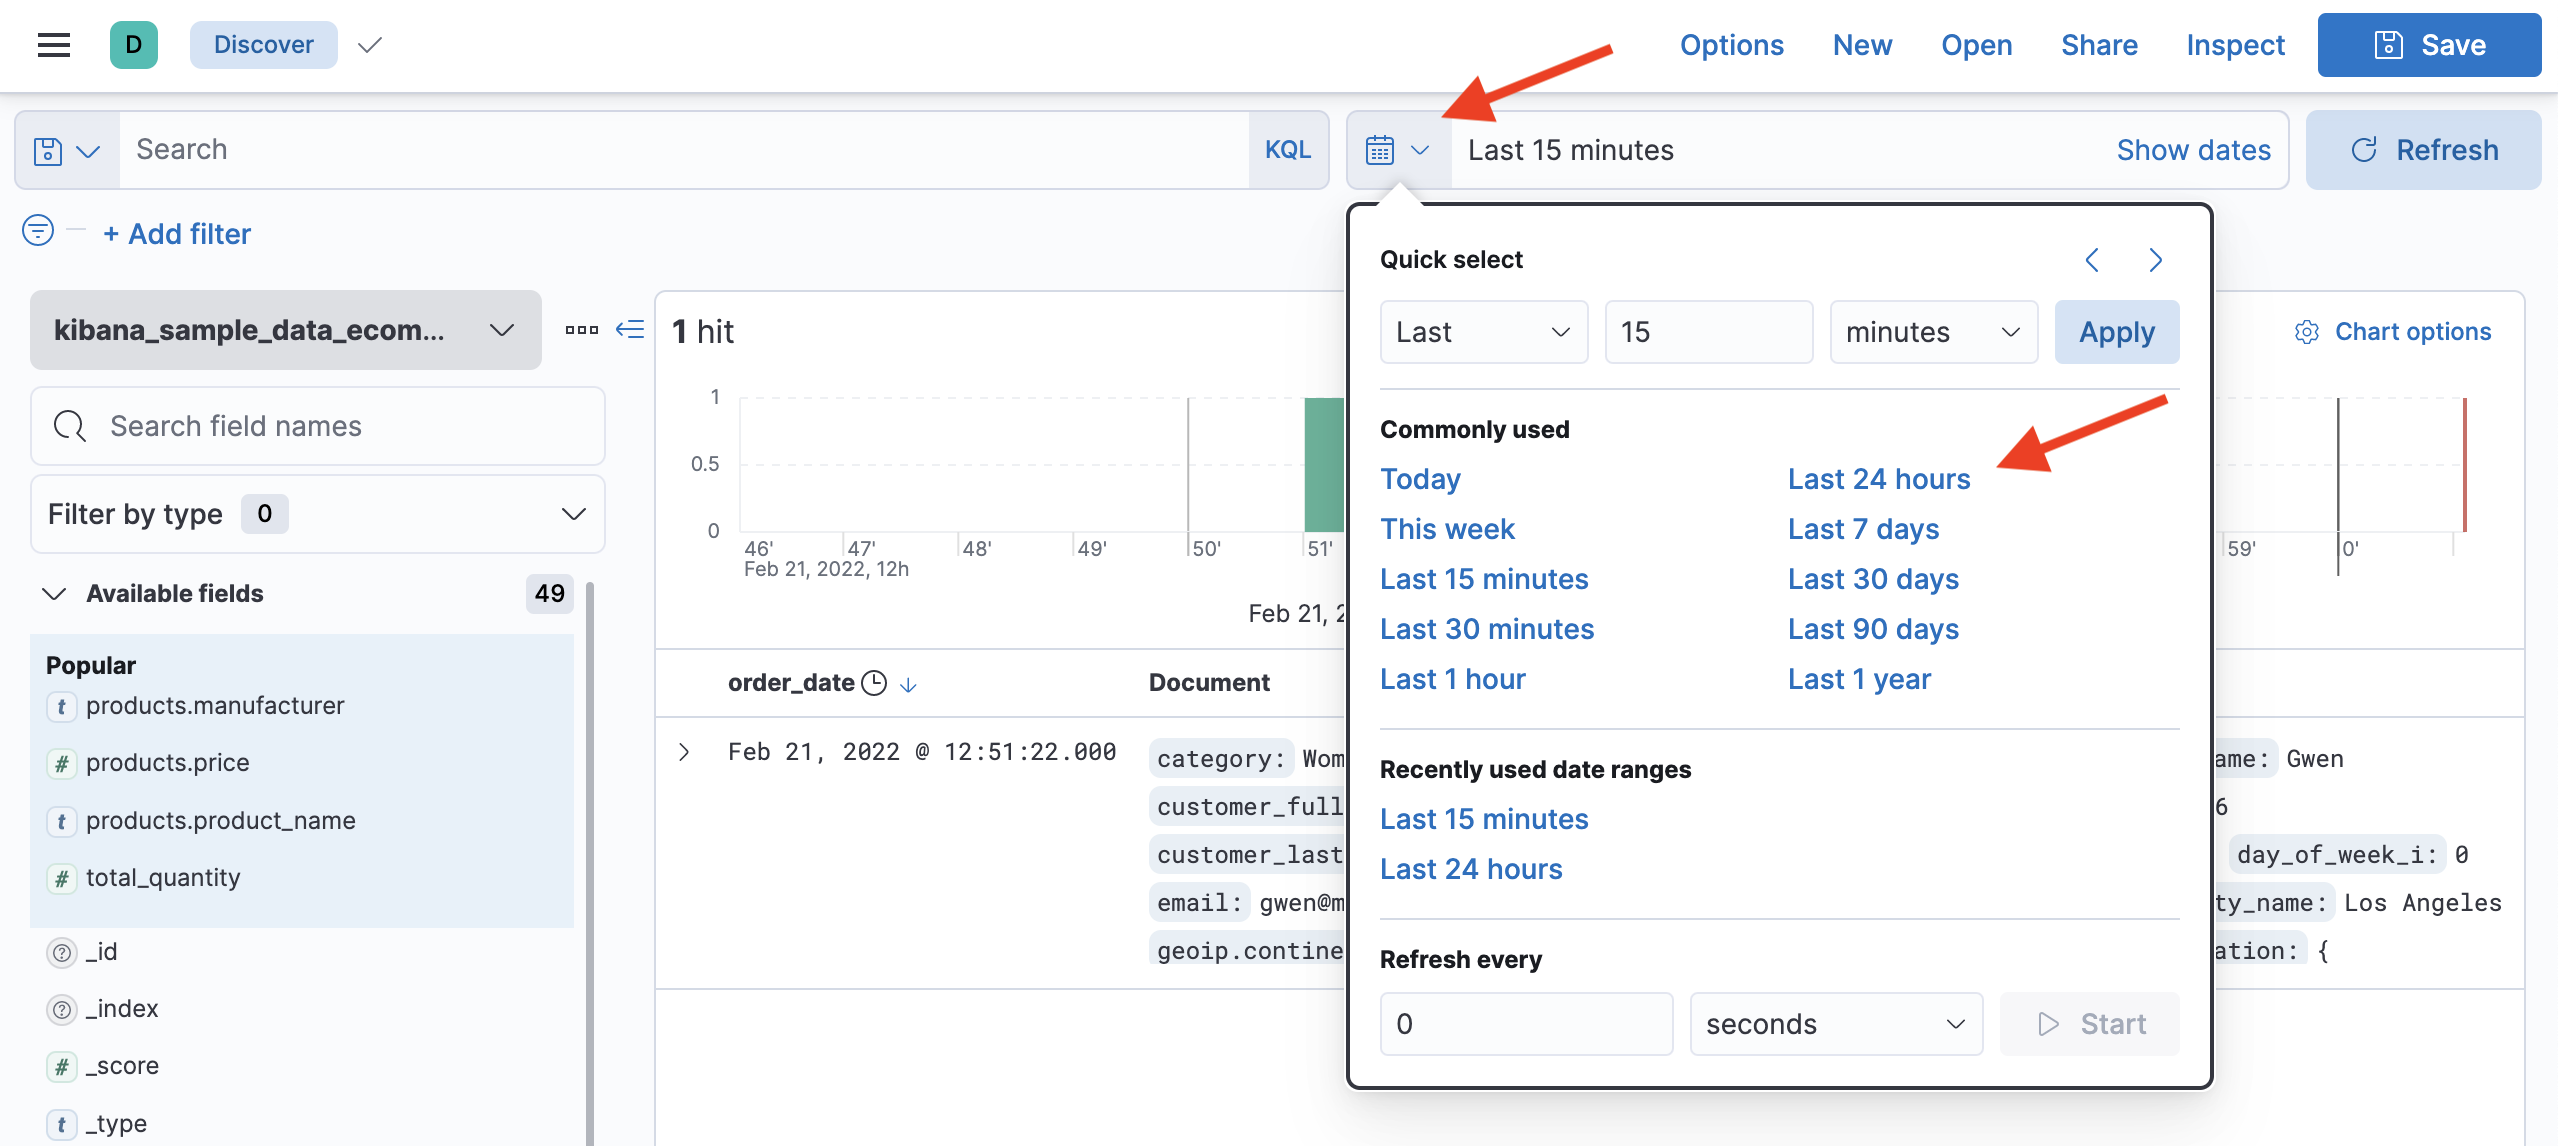 You should see a regular stream of eCommerce orders from the last 24 hours.
 -
From the main menu, select Dashboard. You will see a list of all dashboards - which should only be one dashboard created when you imported the sample dataset. Click on ([eCommerce] Revenue Dashboard) to open that dashboard:
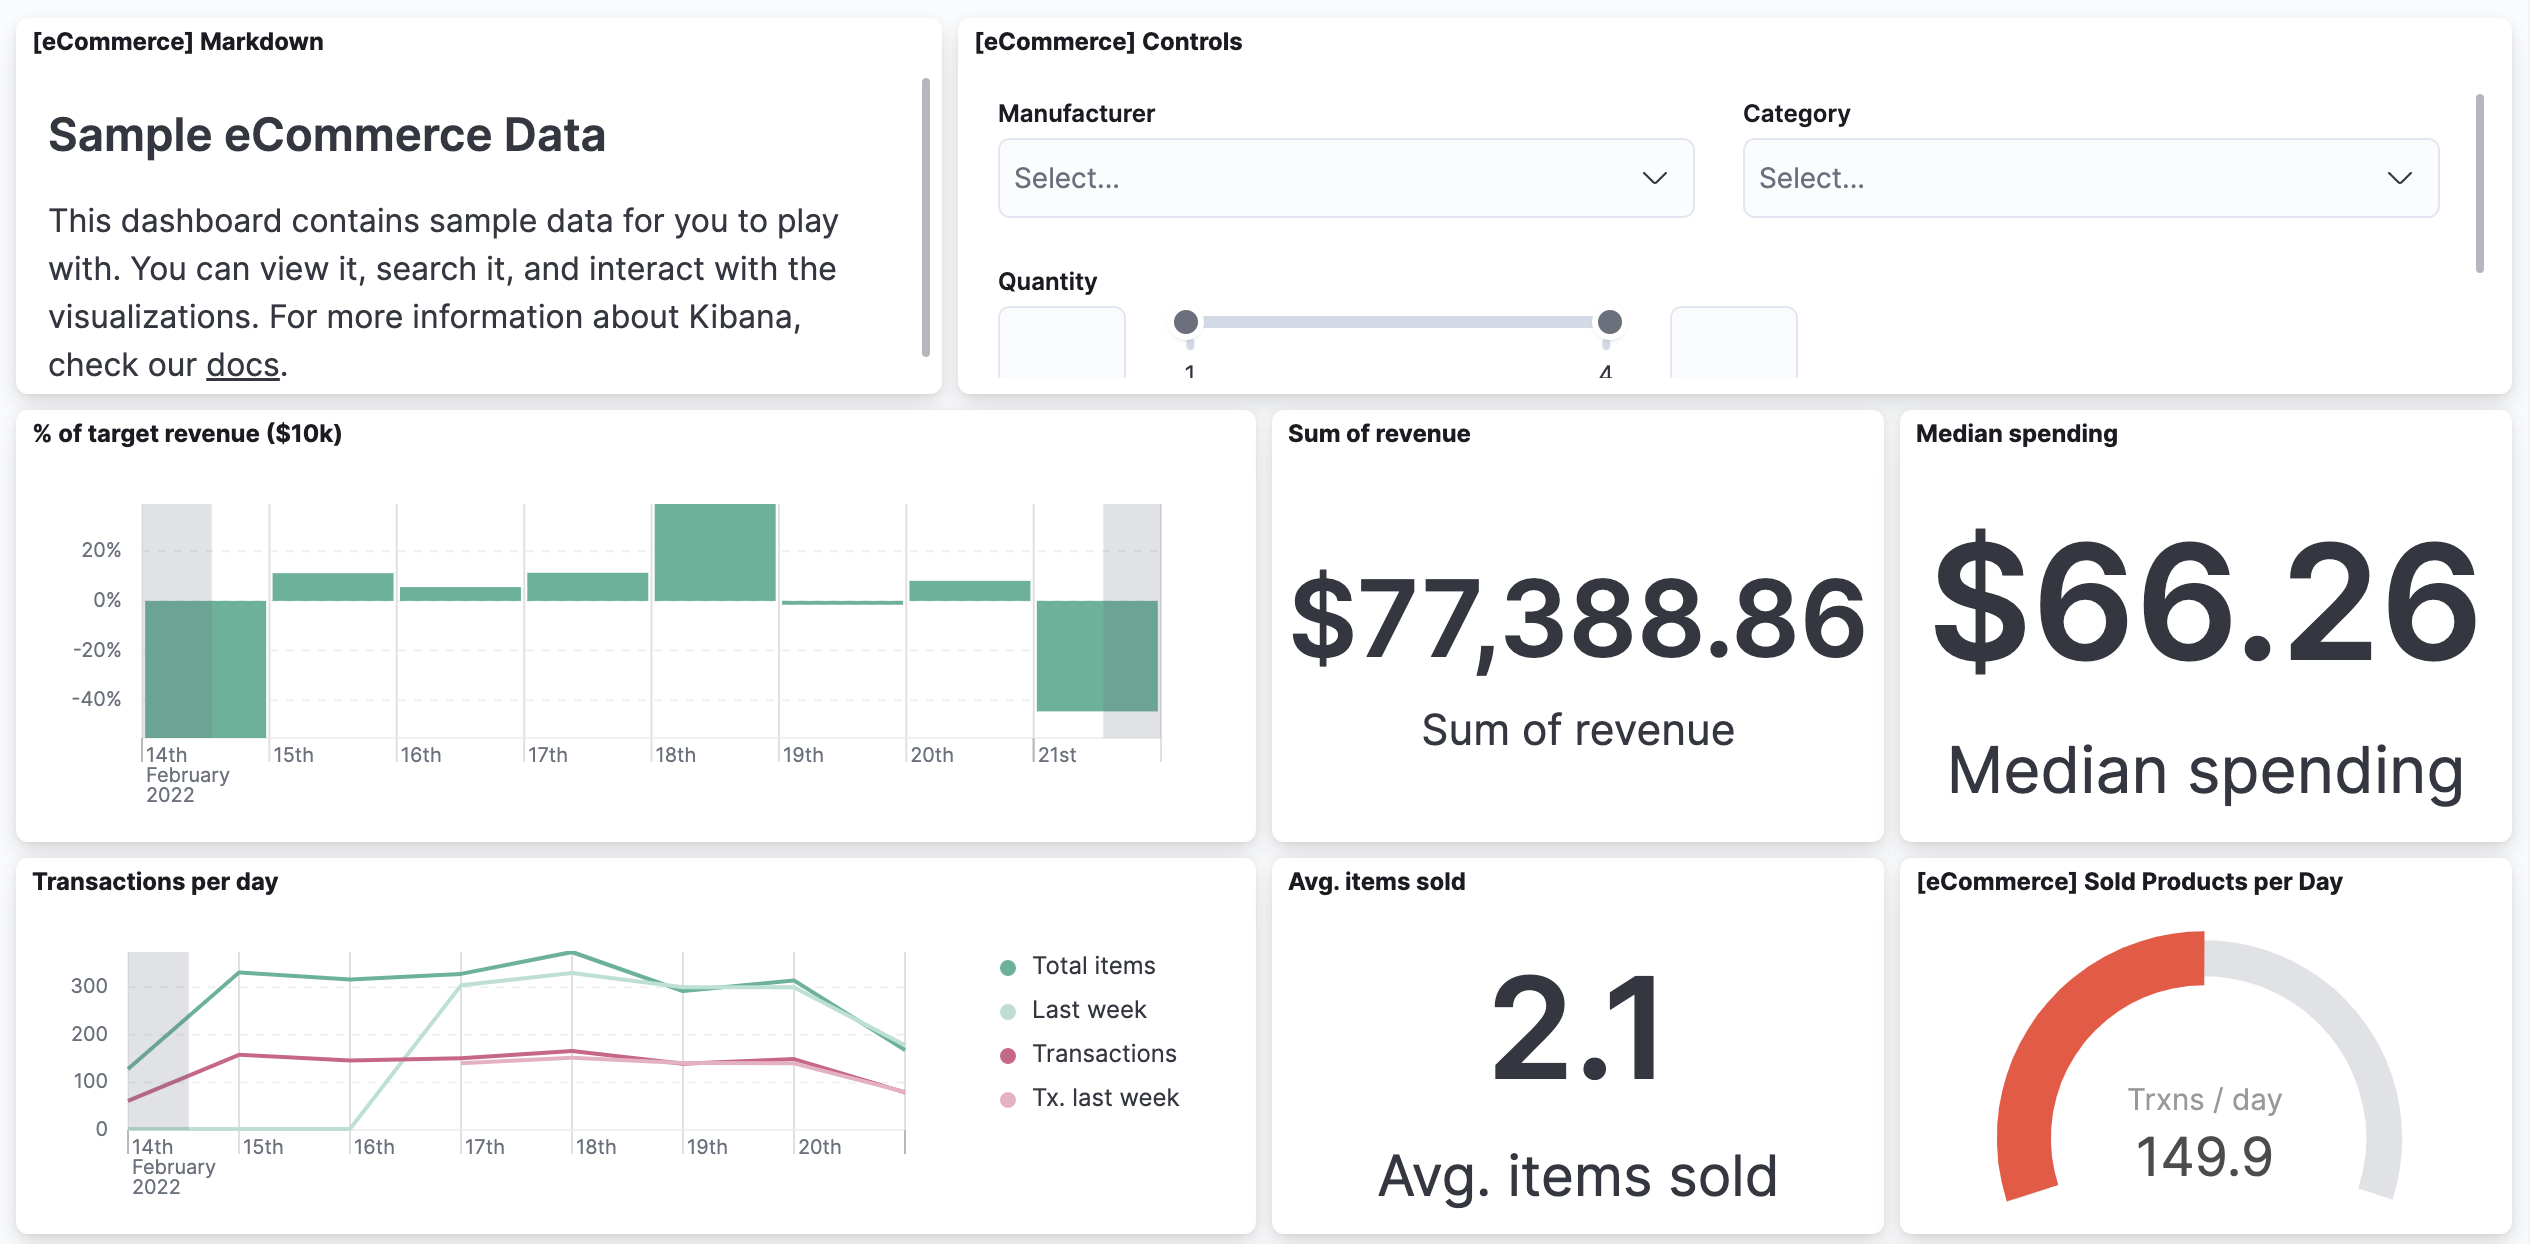 A dashboard consists of one or more visualizations.
 -
From the main menu, select Maps. You will see one map (created from the sample dataset) named [eCommerce] Orders by Country. Open the map:
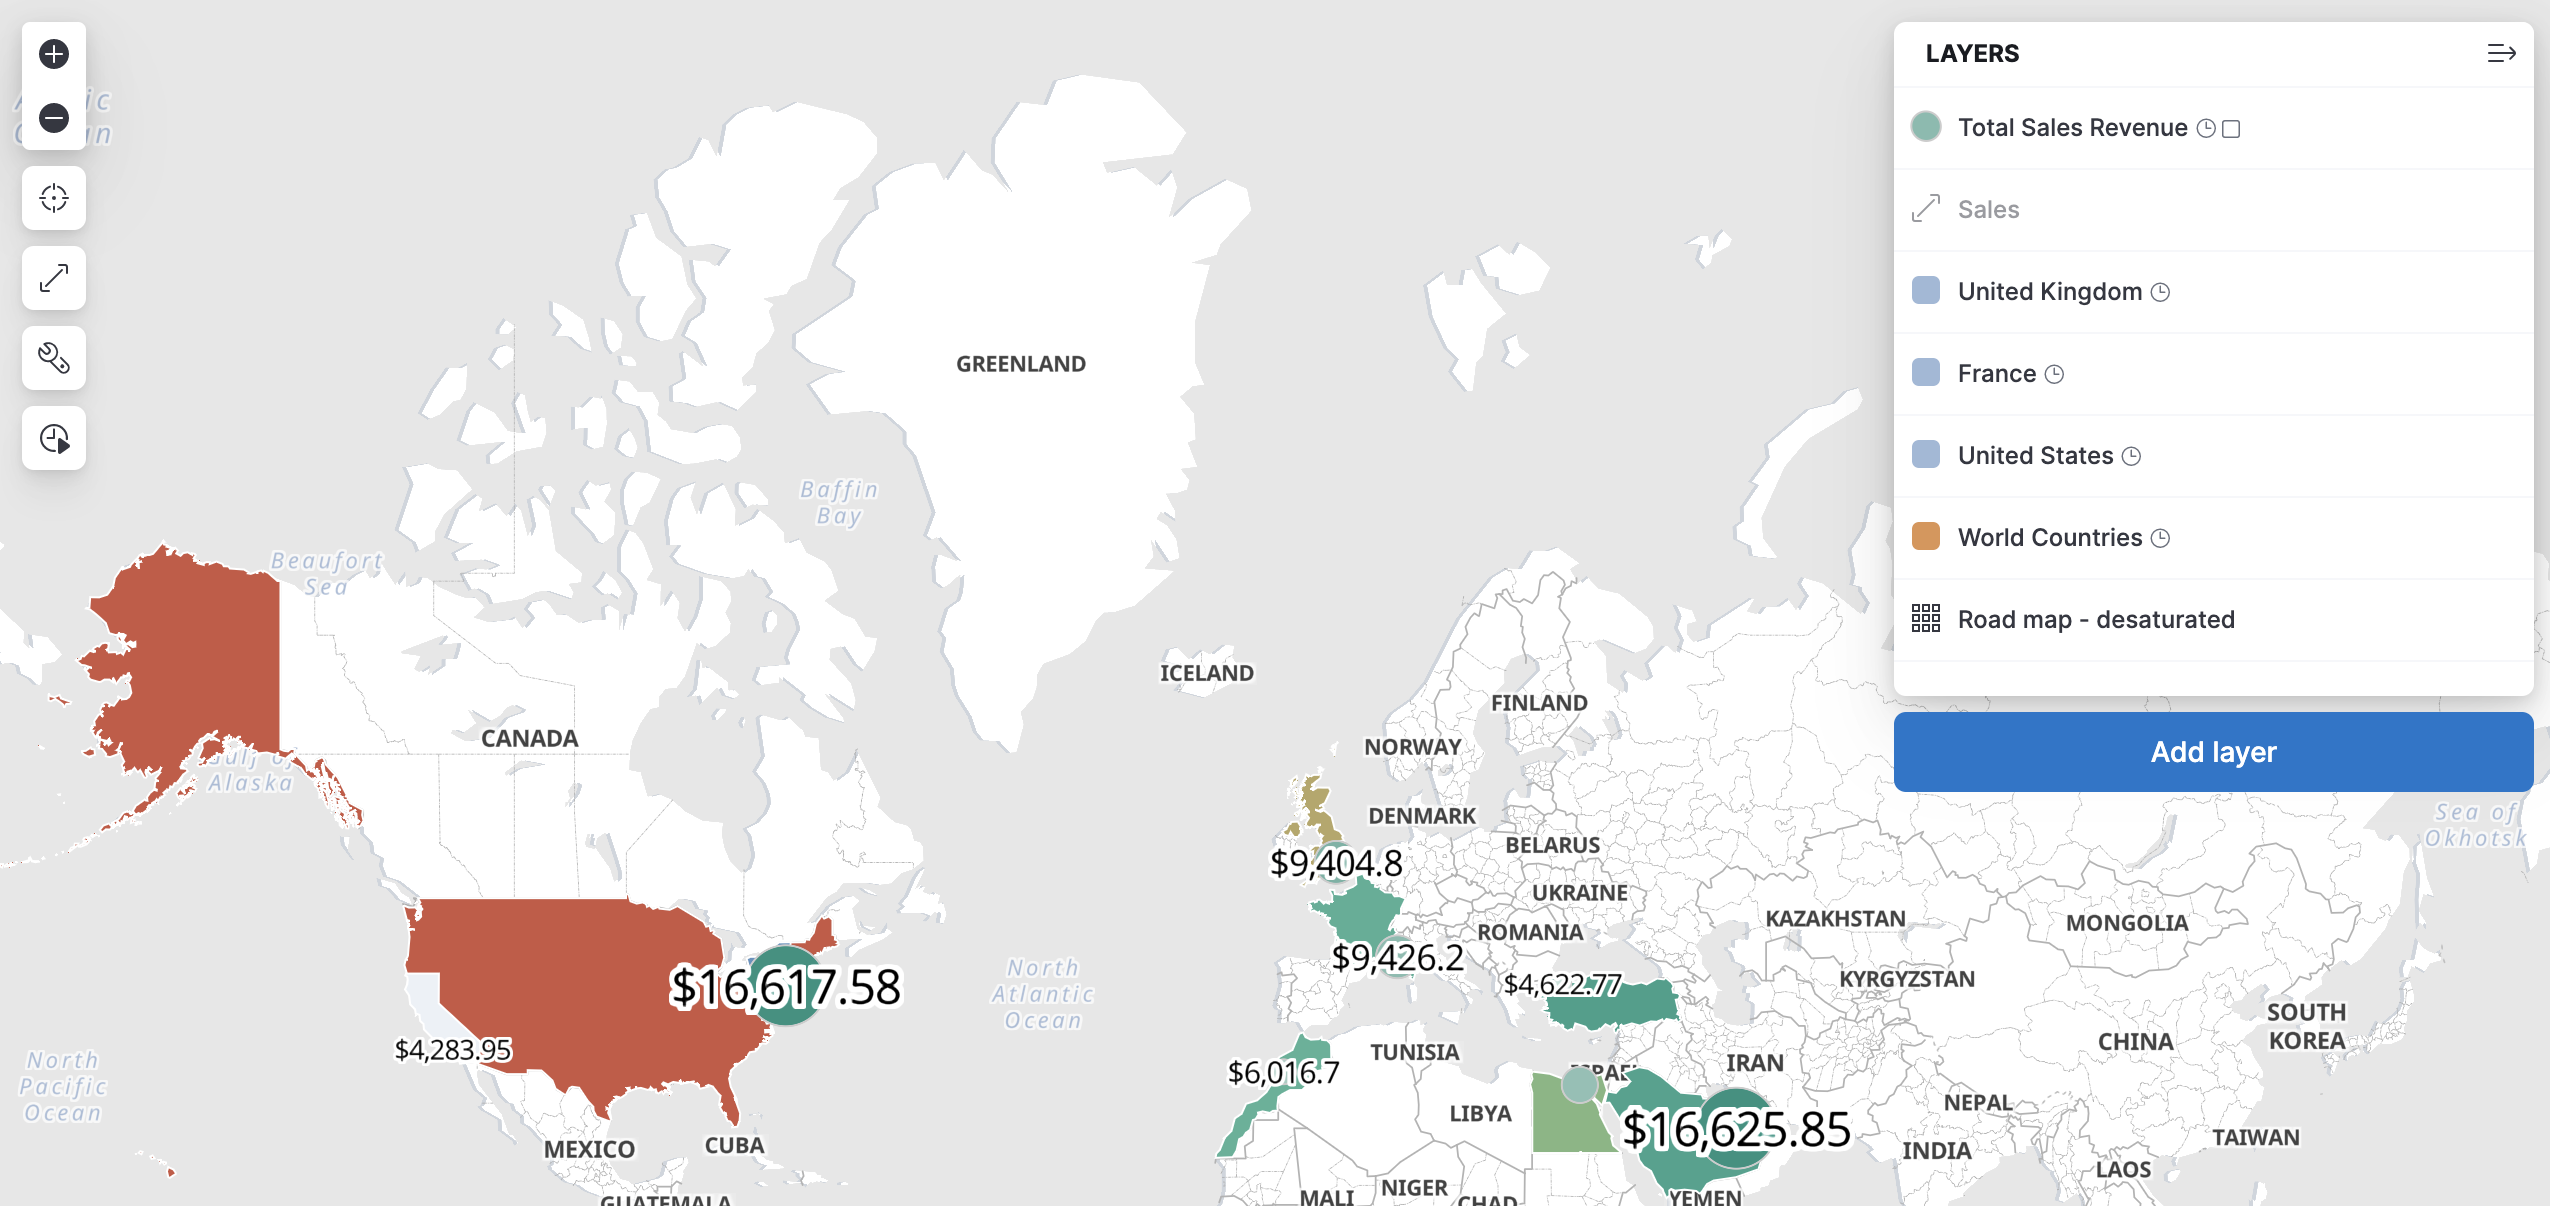 Maps consists of layers - this particular map is displaying the total sales revenue by country. Notice you can zoom in and out and also click on a country to view more details of the data.
 -
From the main menu, select Dev Tools (from the Management section). Here, you will find a collection of developer tools. The default tool displayed is Console. This enables you to send HTTP requests to Elasticsearch and the view the results. There is a
match_allquery written for you already - but go ahead and delete it. -
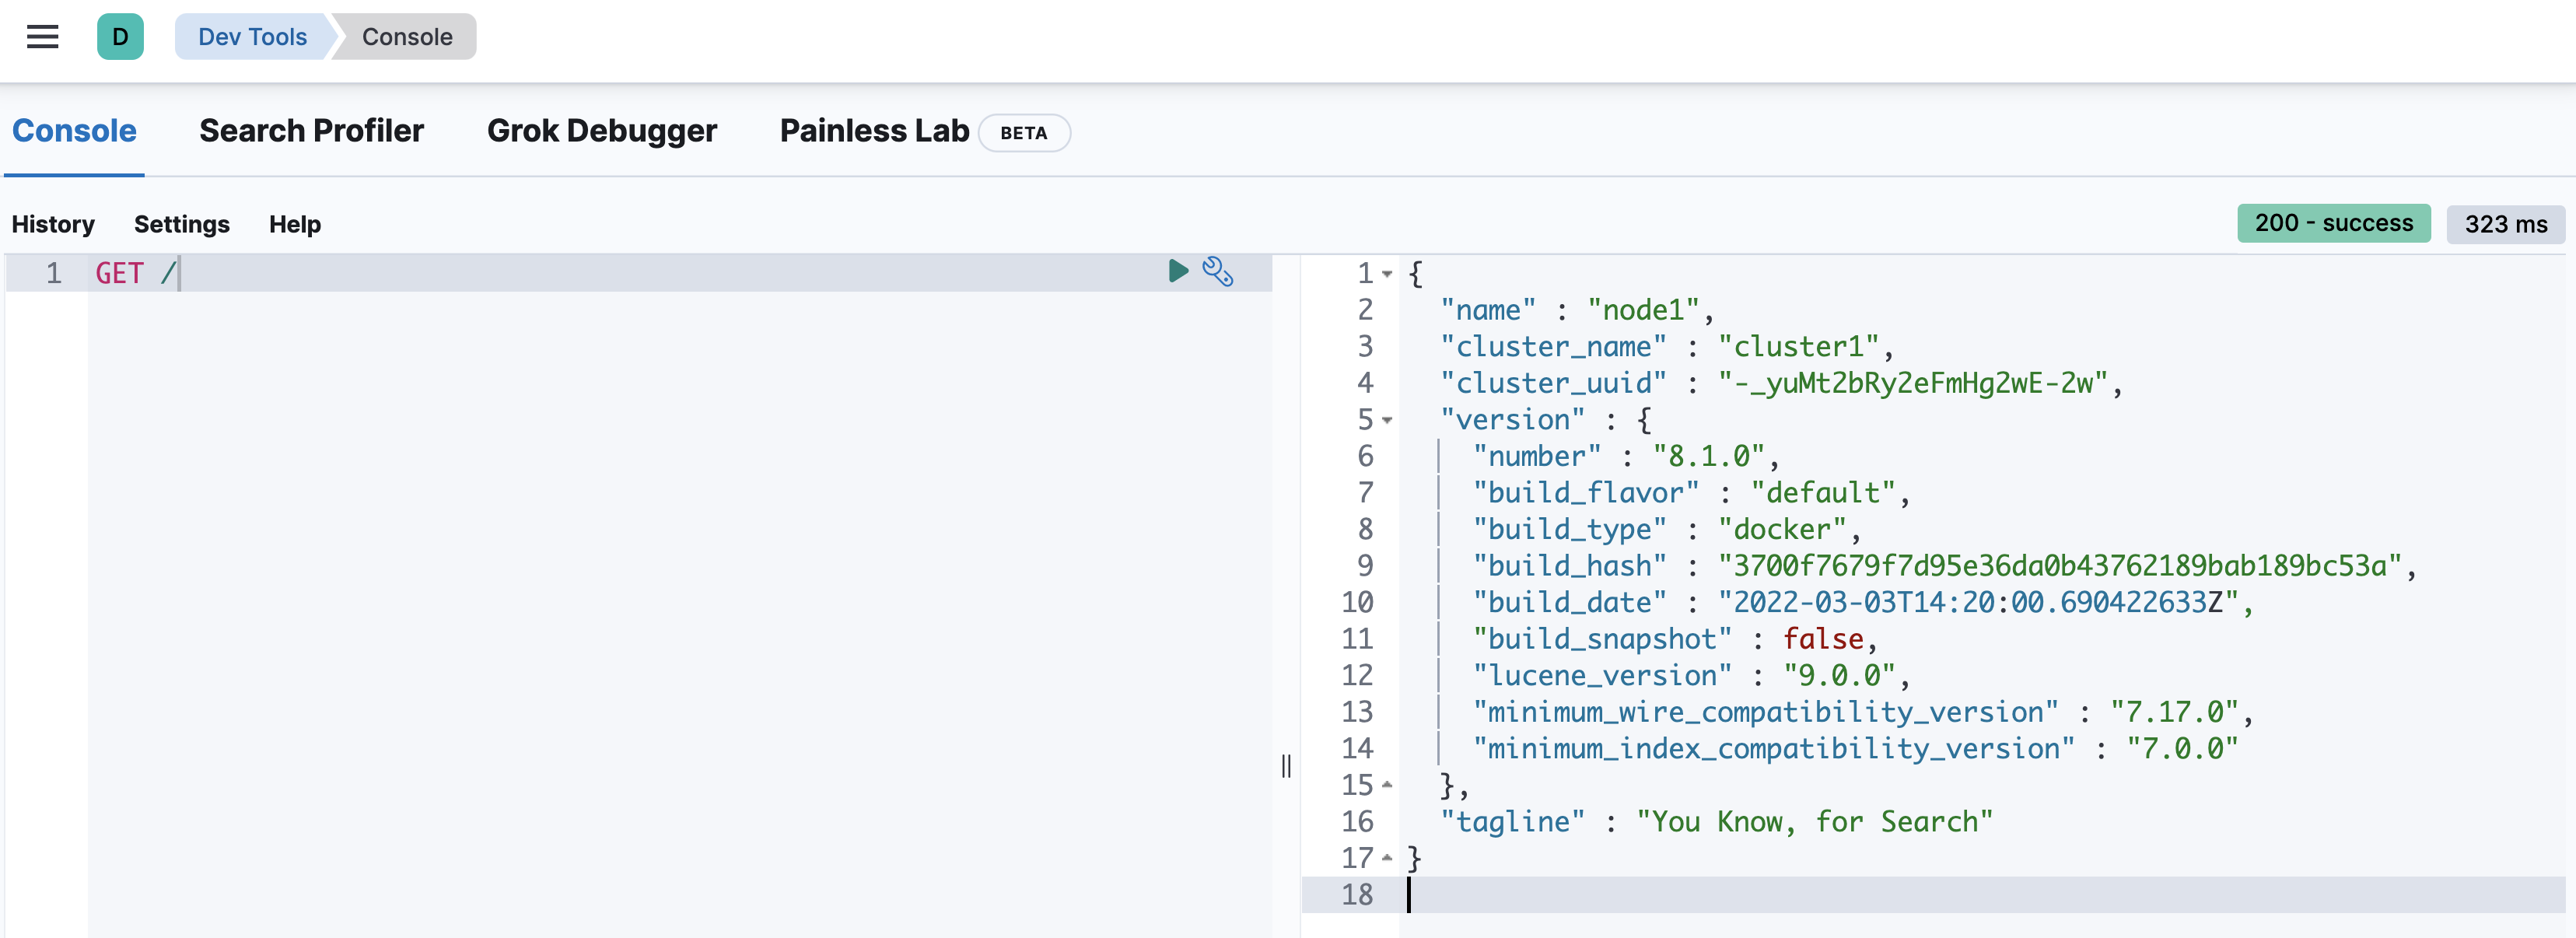
Enter the following command into Console, then click the play icon to send the request:
GET / -
Notice that a simple GET request to Elasticsearch returns basic details about the cluster, along with Shay Banon's famous "You Know, for Search" tagline.
Tip: You can also send a request in Console by pressing Ctrl+enter (or Cmd+enter on a Mac).
-
Use Console to send the following request, which displays the current indexes in the cluster:
You should see the sample eCommerce data you added earlier.GET _cat/indices?v -
We will spend a lot of time in this course searching data. Let's start with a simple "match all" query that returns 10 documents in an index. Submit the following request in Console:
Page down through the results and you will see that the search returned theGET kibana_sample_data_ecommerce/_search_sourceof 10 documents. -
That's all for now, but hopefully you are starting to get comfortable navigating Kibana. Topics like dashboards, maps, and Discover are covered in detail in our Data Analysis with Kibana course. In this course, you will spend a lot of time using Console and also some of the admin tools of Kibana.
Summary:
In this lab, you indexed some of the sample data that ships with Kibana. You also saw some of the features of Kibana. In the next lab, you will learn how to index your own dataset.