Lab 8.2: Troubleshooting
Objective:
In this lab, you will monitor cluster1 using cluster2, then use the CAT APIs to identify any possible issues with cluster1.
-
Metricbeat has been already configured to monitor your three nodes and send the metrics to
cluster2. The following configuration has been used:output.elasticsearch: hosts: ["https://node5:9204"] ## Monitoring cluster protocol: "https" username: "training" password: "nonprodpwd" ssl.verification_mode: none metricbeat.modules: - module: elasticsearch xpack.enabled: true period: 10s hosts: ["https://node1:9200", "https://node2:9200", "https://node3:9200"] username: "training" password: "nonprodpwd" ssl.verification_mode: none -
Go to the Stack Monitoring interface in Kibana2. Make sure to update the time window to the last week.
-
Click Ok to create out-of-the-box rules. This will automatically alert you in case an issue is spotted.
-
Click on Nodes: 3, which links to the Nodes tab of
cluster1. You should seenode1in the table of nodes. Click on node1 to view the metrics being collected: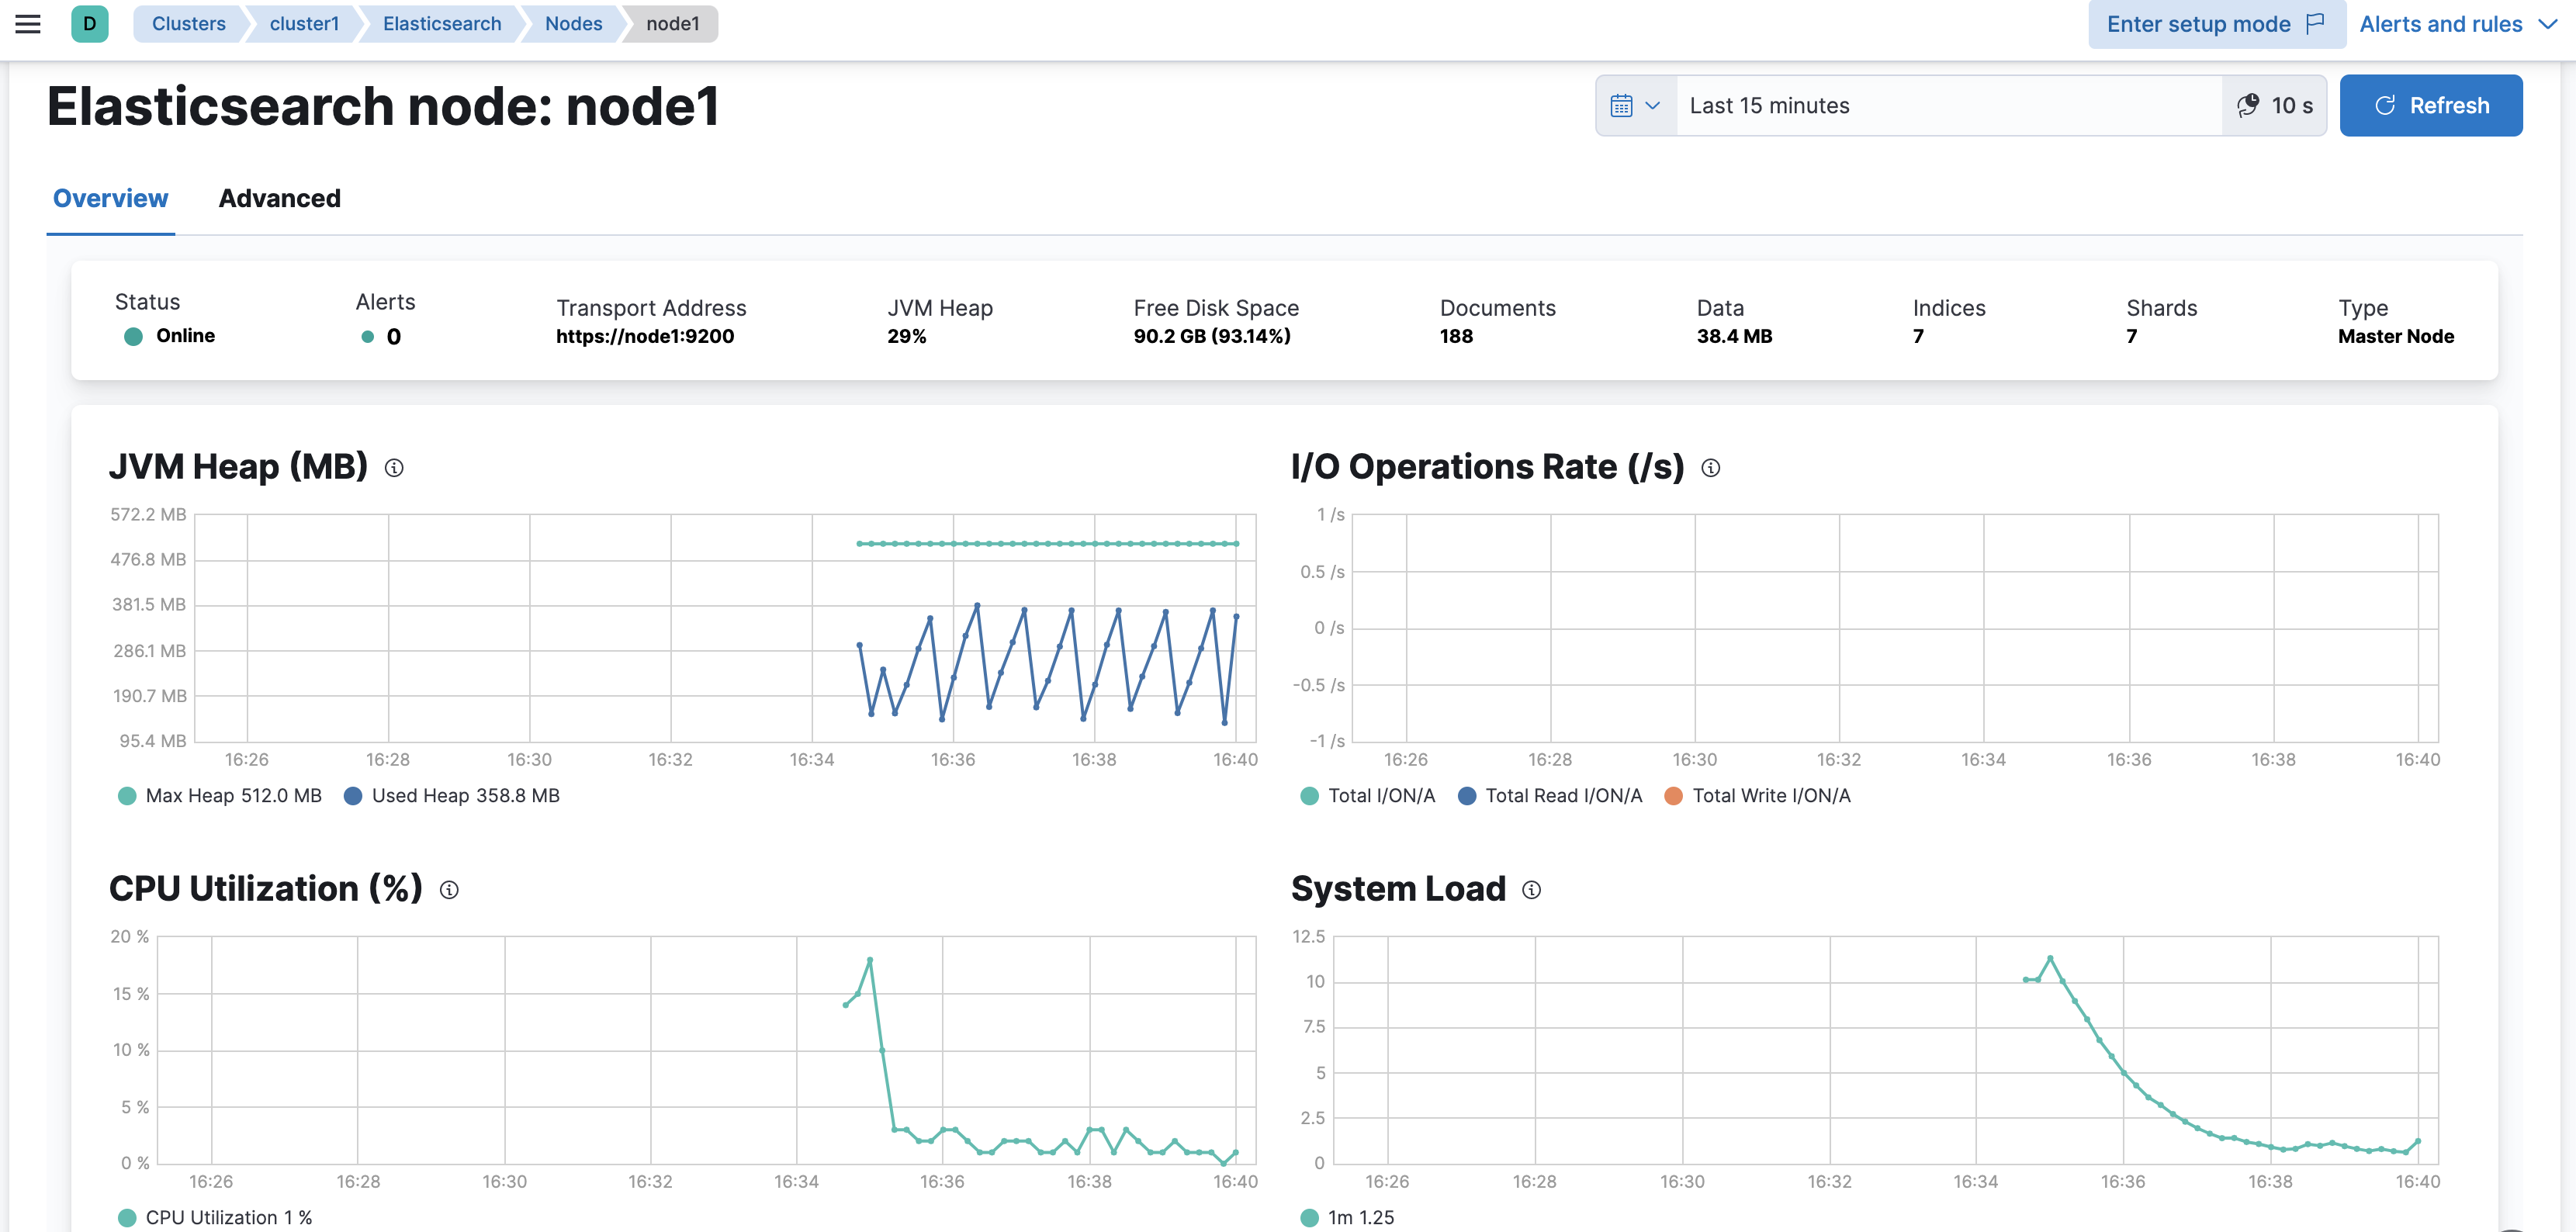
-
Examine the Stack Monitoring interface and identify any nodes or indices under a heavy load. Chances are, everything is fine.
-
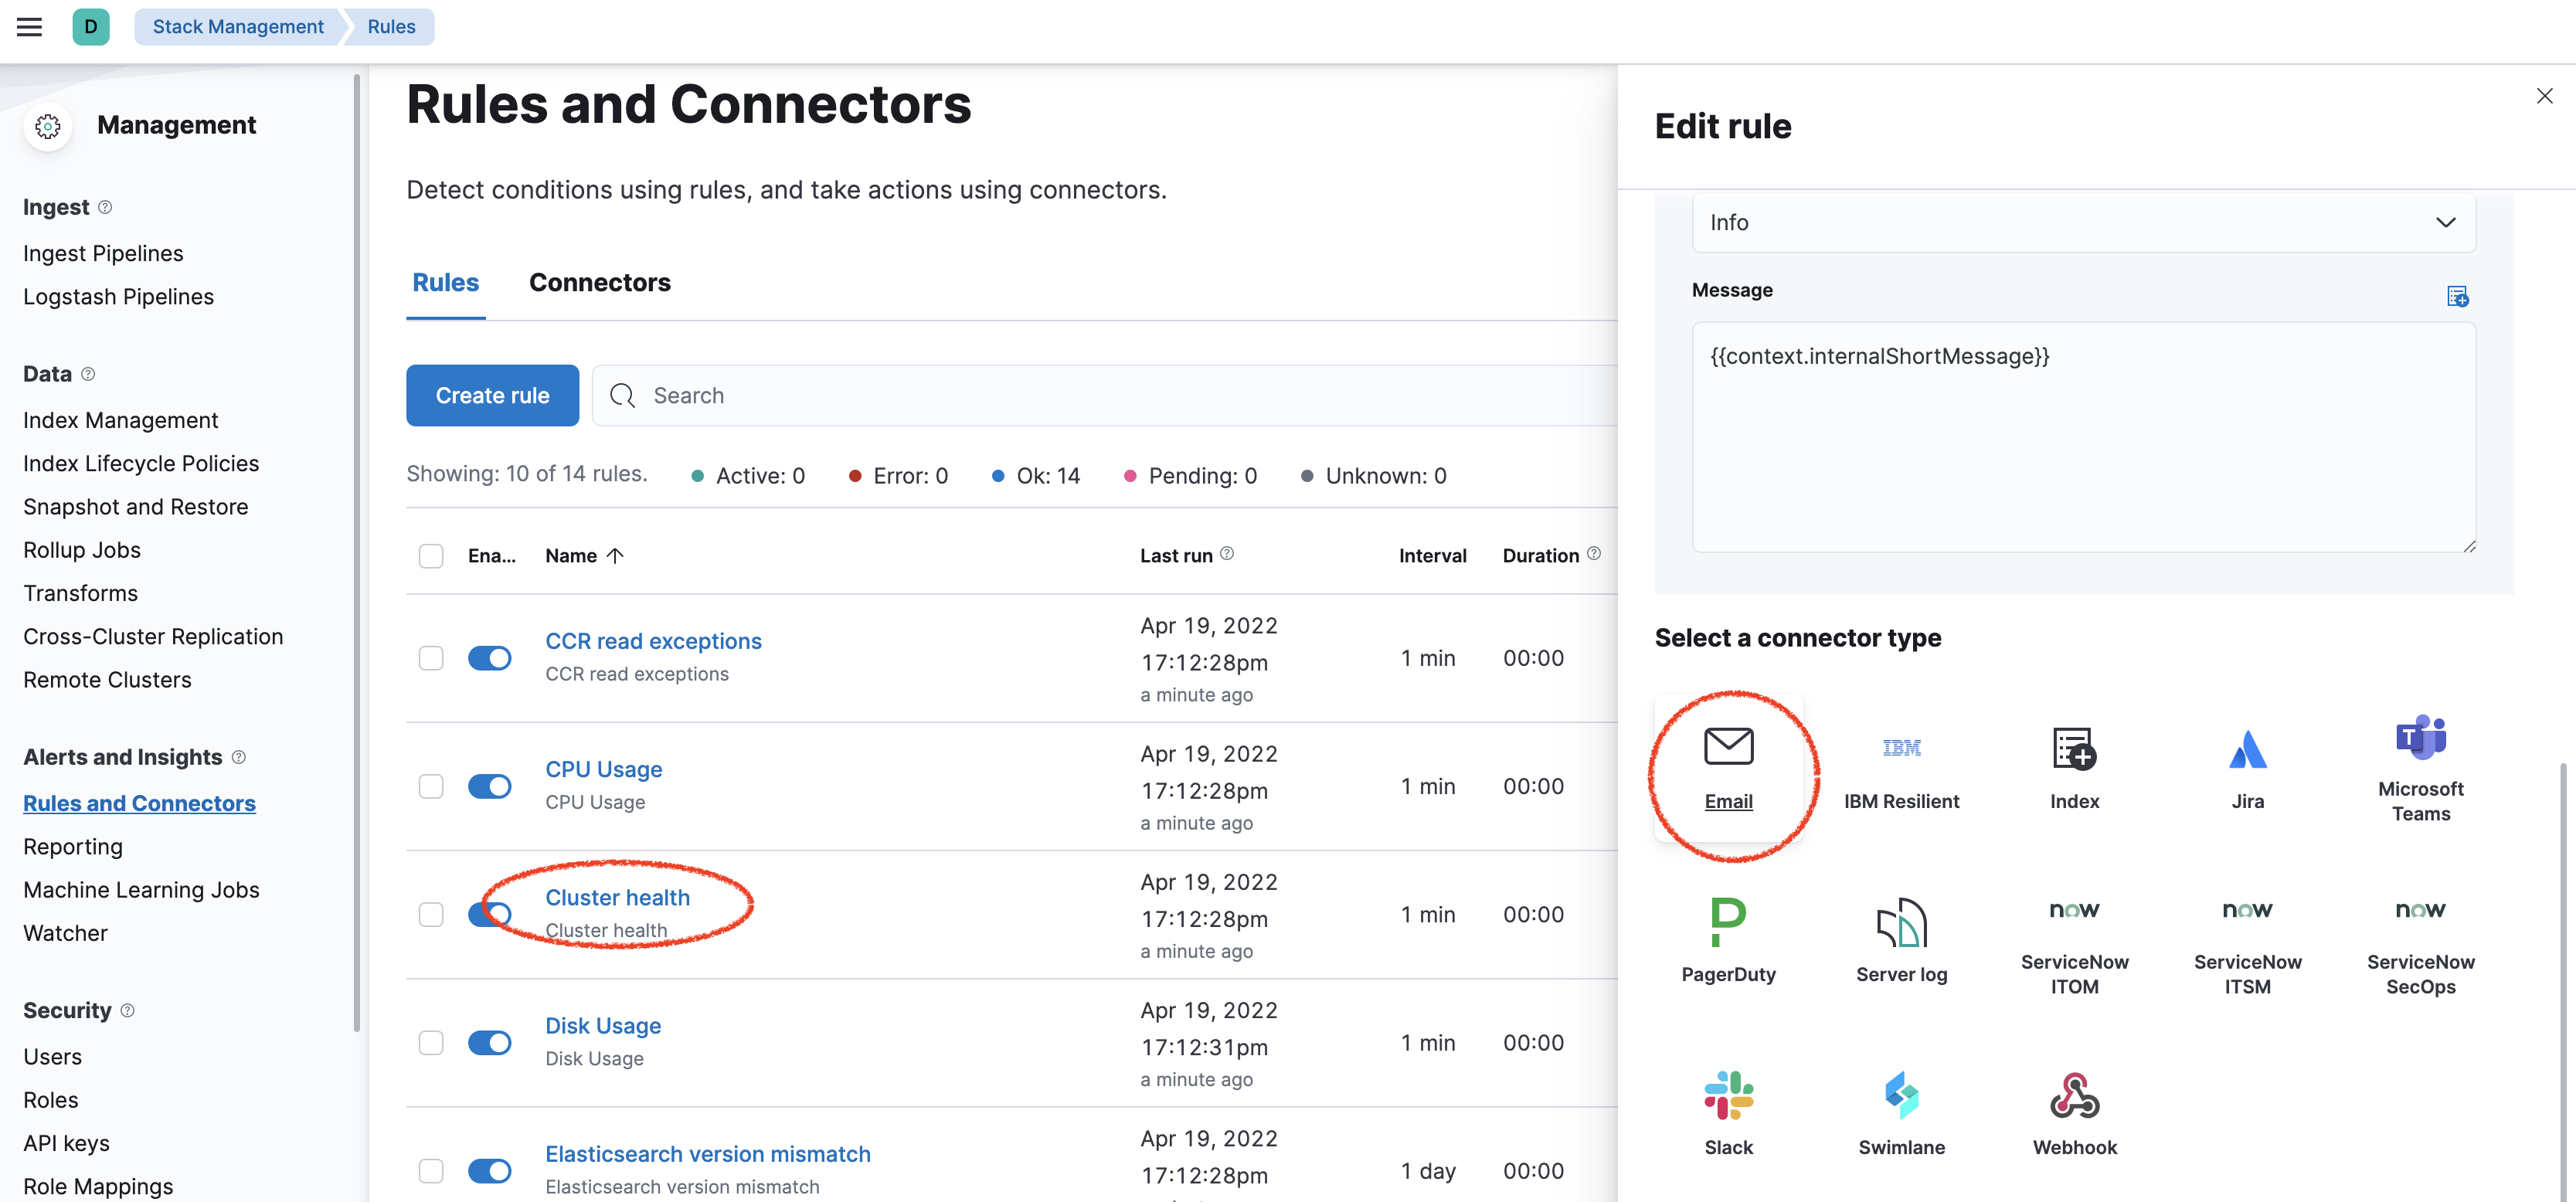
Next, let's update the alerts that were automatically created for you. On the top-right corner, click Alerts and rules and select Manage rules
-
Click on Edit to update the Cluster health alert to add an Email connector.
-
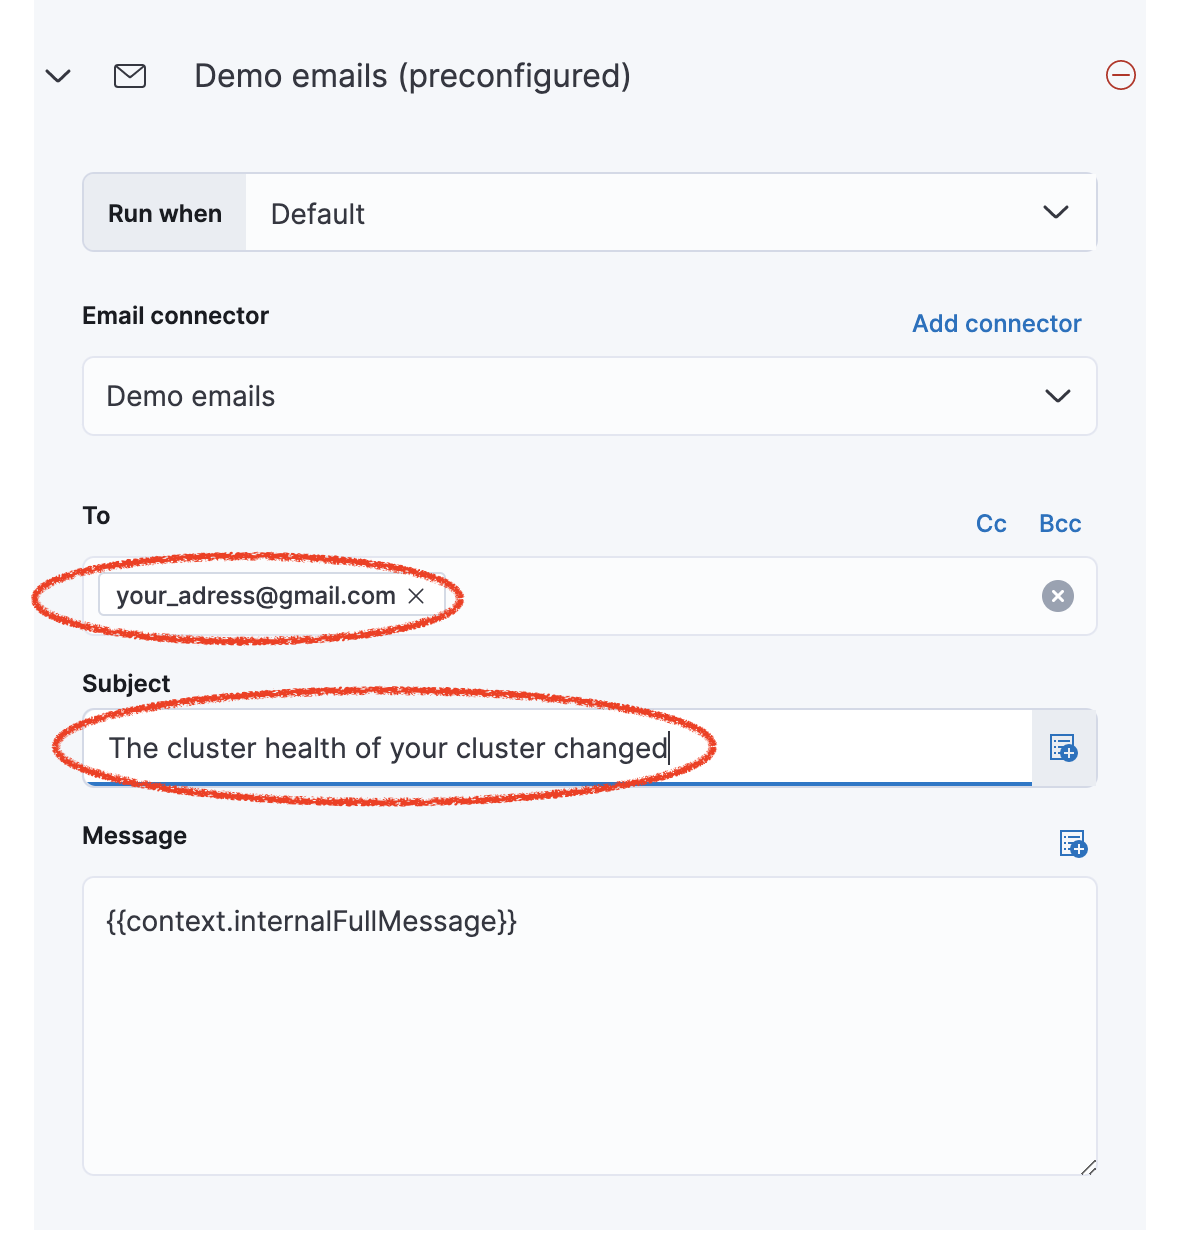
Use the pre-configured email connector (Demo emails), use your own email address and update the subject with a relevant name.
-
Save the rule.
-
Go back to Kibana1 and open Console. Let's introduce a little trouble to the cluster - run the following command, which changes the number of replicas to 5 for the
blogsindex. Becausecluster1only has three nodes, some shards will not be allocated. What will be the health status of the cluster?PUT blogs/_settings { "number_of_replicas": 5 }Solution
Your cluster will be yellow
-
Run
GET _cat/healthandGET _cat/shardsto quickly identify the current cluster state. -
Return to Stack Monitoring in Kibana2. You should now see that your cluster health has gone to yellow, and you might also have an alert waiting for you. Click on Indices and then sort on the status column to identify the troublesome index.
-
Because we have three nodes total, our number of replicas should not exceed 2. On Kibana1, set the number of replicas back to 2:
PUT blogs/_settings
{
  "number_of_replicas": 2
}
Summary:
In this lab, you saw how to set up Stack Monitoring and use the CAT API to view details about your cluster.