Lab 5.4: Transforming Data
Objective:
In this lab, you will transform the web_traffic index to get the number of visitors per blog.
-
Write an aggregation to get the number of views for each distinct URL.
Solution
Notice that you get only the number of views for the top 10 URLs.GET web_traffic/_search { "size": 0, "aggs": { "NAME": { "terms": { "field": "url.original" } } } } -
What is the most popular blog?
Solution
The blog
/blog/introducing-elastic-endpoint-securitythat has 63989 views. -
EXAM PREP: Next, let's create a transform to answer the same question. Using the Transforms UI in Kibana, create a transform that satisfies the following requirements:
- counts the number of visitors to a blog page (using the
url.originalfield) - computes the average load time (the
runtime_msfield) of all the visits to a blog page -
the name of the transform ID and destination index are both
traffic_statsSolution
Complete the following steps:
a. Go to Stack Management > Transforms > Create your first transform:
- choose the
web_trafficsource - select Pivot
- set Group by to
terms(url.original)
b. Add two Aggregations
value_count(@timestamp)avg(runtime_ms)
c. Click on Next
- set the Transform ID to
traffic_stats - set the Destination index to
traffic_stats
d. Click on Next
- then click the Create and start button to start the transform
You can also complete this task by running the following command in Console:
Then start the transform:PUT _transform/traffic_stats { "source": { "index": [ "web_traffic" ] }, "pivot": { "group_by": { "url.original": { "terms": { "field": "url.original" } } }, "aggregations": { "@timestamp.value_count": { "value_count": { "field": "@timestamp" } }, "runtime_ms.avg": { "avg": { "field": "runtime_ms" } } } }, "frequency": "1m", "dest": { "index": "traffic_stats" }, "settings": { "max_page_search_size": 500 } }POST _transform/traffic_stats/_start - choose the
- counts the number of visitors to a blog page (using the
-
When your transform is finished being created, go to Discover and select the
traffic_statsdata view. This is not time-series data, so there is no time filter, but you should see over 12,000 documents in the index. Click on one to view the documents, which look like the following. Notice that for each unique URL, you should see the number of visits to the blog and also the average of theruntime_msfield:{ "_index": "traffic_stats", "_type": "_doc", "_id": "L4jn1iGrM-Pa3uGLQjl57JsAAAAAAAAA", "_version": 1, "_score": 0, "fields": { "runtime_ms.avg": [ 675853.4411764706 ], "url.original": [ "/blog/brewing-beats-new-beats-dashboards-management" ], "@timestamp.value_count": [ 68 ] } } -
Use the query bar to search for
/blog/introducing-elastic-endpoint-security.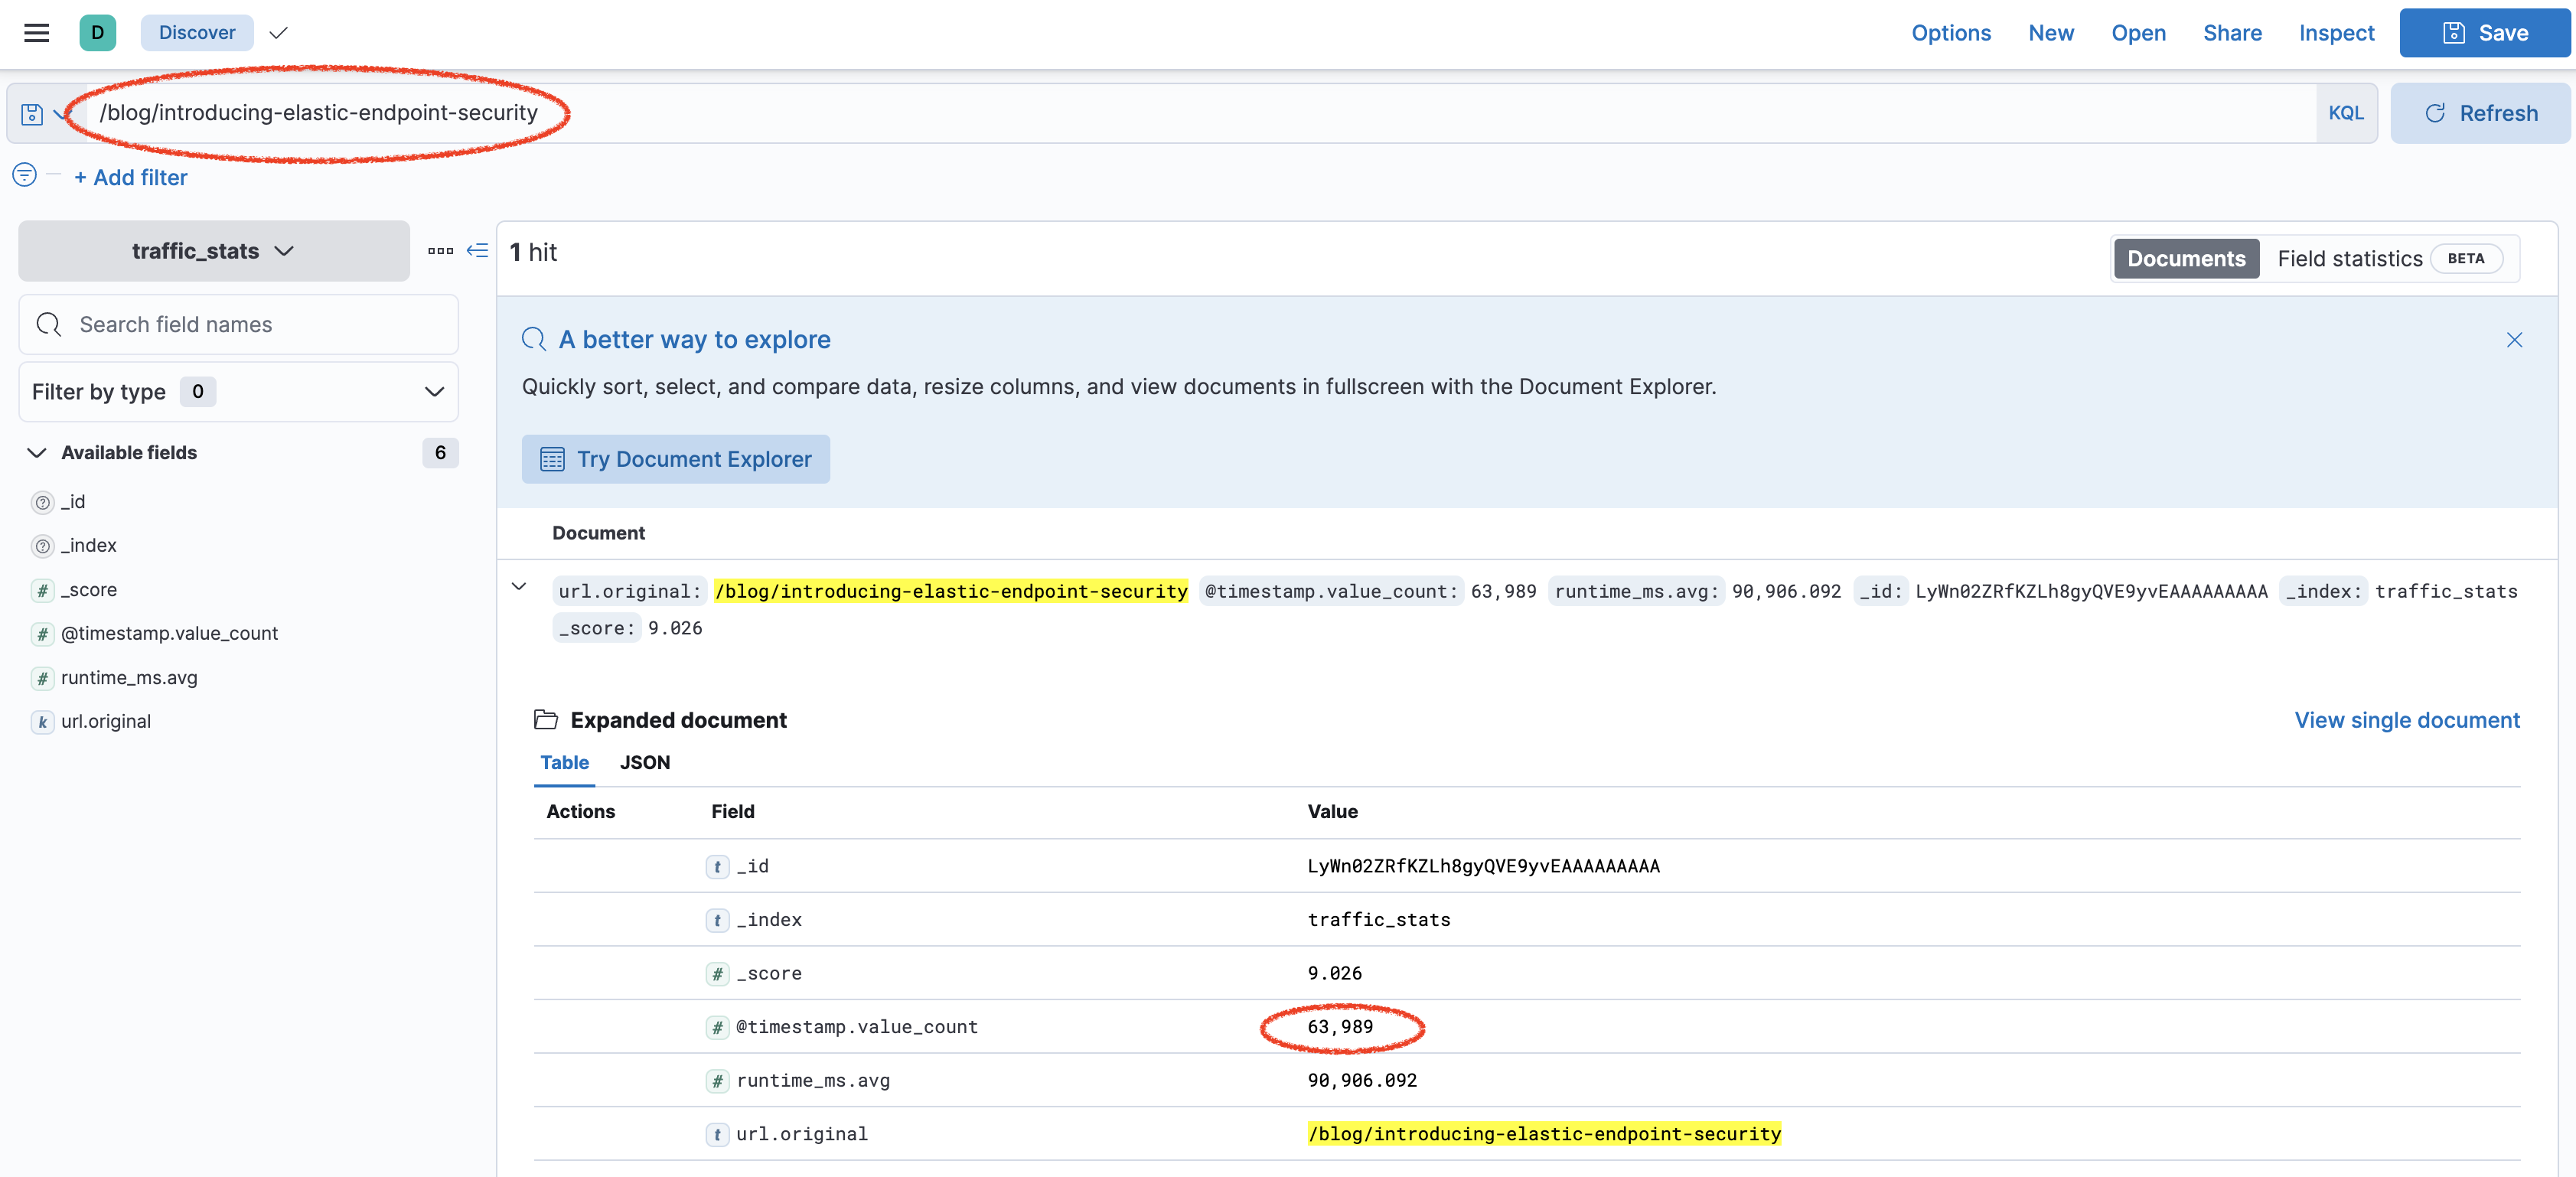
-
You should get the same number of views. You now have an efficient way to get the number of views for every blog.
Summary:
In this lab, you created and started a pivot transform to compute the number of visitors for each blog page and the average time the pages took to load.