Lab 4.1: Changing data
Objective:
In this lab, you will learn how to reindex or delete documents. You will also learn how to define an ingest node pipeline.
-
The
blogsindex on the remote clustercluster2contains 7 documents. Index those 7 documents into your existingblogs_fixed2index oncluster1using the Reindex API. You will need the following details:- the username is
training - the password is
nonprodpwd - the hostname for
cluster2isnode5and is using SSL on port 9204
Note that the
elasticsearch.ymlfile oncluster1has all the necessary settings, so you will not need to change it. Here are the settings that were added for the remote reindex to work:You can view the entire file by running the following command in the terminal:reindex.remote.whitelist: node5:9204 reindex.ssl.certificate_authorities: /usr/share/elasticsearch/config/certificates/ca/ca.crt reindex.ssl.verification_mode: nonecat /home/ubuntu/elasticsearch/elasticsearch1.ymlSolution
POST _reindex { "source": { "remote": { "host": "https://node5:9204", "username": "training", "password": "nonprodpwd" }, "index": "blogs" }, "dest": { "index": "blogs_fixed2" } } - the username is
-
Run a
_count_onblogs_fixed2and verify that you have 4,726 documents, which is 7 more than you had before:GET blogs_fixed2/_count -
Delete all the documents in
blogs_fixed2wheretags.use_caseequalsuptime monitoring. You should see 67 documents deleted.Solution
POST blogs_fixed2/_delete_by_query { "query": { "match": { "tags.use_case": "uptime monitoring" } } } -
EXAM PREP: Elastic's web team has been tracking the visitors to our blogs. Here is an example of a log from one of those visits:
Using the Ingest Node Pipeline UI, create an ingest pipeline that satisfies the following requirements:{ "@timestamp": "2021-03-21T19:25:05.000-06:00", "bytes_sent": 26774, "content_type": "text/html; charset=utf-8", "geoip_location_lat": 39.1029, "geoip_location_lon": -94.5713, "is_https": true, "request": "/blog/introducing-elastic-endpoint-security", "response": 200, "runtime_ms": 191, "user_Agent": "Mozilla/5.0 (compatible; MJ12bot/v1.4.8; http://mj12bot.com/)", "verb": "GET" }- the name of the pipeline is web_traffic_pipeline
- removes the field
is_https - renames the field
requesttourl.original - renames the field
verbtohttp.request.method - renames the field
responsetohttp.response.status_code - renames the field
geoip_location_lattogeo.location.lat - renames the field
geoip_location_lontogeo.location.lon - uses the
user_agentprocessor on the fielduser_Agent - removes the field
user_Agent - above processors should ignore documents that do not have the specified fields
Test the pipeline on the sample document above. The output should look like this
{
          "geo": {
            "location": {
              "lon": -94.5713,
              "lat": 39.1029
            }
          },
          "@timestamp": "2021-03-21T19:25:05.000-06:00",
          "content_type": "text/html; charset=utf-8",
          "runtime_ms": 191,
          "http": {
            "request": {
              "method": "GET"
            },
            "response": {
              "status_code": 200
            }
          },
          "bytes_sent": 26774,
          "url": {
            "original": "/blog/introducing-elastic-endpoint-security"
          },
          "user_agent": {
            "name": "MJ12bot",
            "original": "Mozilla/5.0 (compatible; MJ12bot/v1.4.8; http://mj12bot.com/)",
            "device": {
              "name": "Spider"
            },
            "version": "1.4.8"
          }
        }
Solution
In Kibana go to Stack Management > Ingest Node Pipelines. Click on Create new pipeline, then add each processor. If you want to bypass the UI and define the pipeline using an HTTP request, copy-and-paste the following into Console:
You can test your pipeline by running the following command:PUT _ingest/pipeline/web_traffic_pipeline { "processors": [ { "remove": { "field": "is_https", "ignore_missing": true } }, { "rename": { "field": "request", "target_field": "url.original", "ignore_missing": true } }, { "rename": { "field": "verb", "target_field": "http.request.method", "ignore_missing": true } }, { "rename": { "field": "response", "target_field": "http.response.status_code", "ignore_missing": true } }, { "rename": { "field": "geoip_location_lat", "target_field": "geo.location.lat", "ignore_missing": true } }, { "rename": { "field": "geoip_location_lon", "target_field": "geo.location.lon", "ignore_missing": true } }, { "user_agent": { "field": "user_Agent", "ignore_missing": true } }, { "remove": { "field": "user_Agent", "ignore_missing": true } } ] }GET _ingest/pipeline/web_traffic_pipeline/_simulate { "docs": [ { "_index": "index", "_id": "id", "_source": { "@timestamp": "2021-03-21T19:25:05.000-06:00", "bytes_sent": 26774, "content_type": "text/html; charset=utf-8", "geoip_location_lat": 39.1029, "geoip_location_lon": -94.5713, "is_https": true, "request": "/blog/introducing-elastic-endpoint-security", "response": 200, "runtime_ms": 191, "user_Agent": "Mozilla/5.0 (compatible; MJ12bot/v1.4.8; http://mj12bot.com/)", "verb": "GET" } } ] } -
EXAM PREP: Once your pipeline is working, define a new index named
web_traffic. Configureweb_traffic_pipelineas the default pipeline forweb_traffic. Use the following mapping forweb_traffic(copy-and-paste it into your PUT request):"mappings": { "properties": { "@timestamp": { "type": "date" }, "geo": { "properties": { "location": { "type": "geo_point" } } }, "http": { "properties": { "request": { "properties": { "method": { "type": "keyword" } } }, "response": { "properties": { "status_code": { "type": "keyword" } } } } }, "runtime_ms": { "type": "long" }, "url": { "properties": { "original": { "type": "keyword", "fields": { "text": { "type": "text" } } } } }, "user_agent": { "properties": { "device": { "properties": { "name": { "type": "keyword" } } }, "name": { "type": "keyword" }, "original": { "type": "keyword", "fields": { "text": { "type": "text" } } }, "version": { "type": "keyword" } } } } }Solution
PUT web_traffic { "settings": { "default_pipeline": "web_traffic_pipeline" }, "mappings": { "properties": { "@timestamp": { "type": "date" }, "geo": { "properties": { "location": { "type": "geo_point" } } }, "http": { "properties": { "request": { "properties": { "method": { "type": "keyword" } } }, "response": { "properties": { "status_code": { "type": "keyword" } } } } }, "runtime_ms": { "type": "long" }, "url": { "properties": { "original": { "type": "keyword", "fields": { "text": { "type": "text" } } } } }, "user_agent": { "properties": { "device": { "properties": { "name": { "type": "keyword" } } }, "name": { "type": "keyword" }, "original": { "type": "keyword", "fields": { "text": { "type": "text" } } }, "version": { "type": "keyword" } } } } } } -
Test your pipeline by running the following script within a Terminal window in Strigo. The script indexes a few log events into the
web_trafficindex:cd datasets ./test_webtraffic.sh -
Check your
web_trafficindex and verify everything is working.Solution
Run a search request and verify that your documents have the correct structure.
GET web_traffic/_search -
If the sample documents look correct, delete them by running the following command into Console:
POST web_traffic/_delete_by_query { "query": { "match_all": {} } } -
You will now index about 1.4 million log events, which is about a month's worth of logs. From the same folder, run the provided
load_webtraffic.shscript:It will take several minutes for all 1,462,658 documents to be indexed. Let it run and move on to the next step../load_webtraffic.sh -
Create a data view in Kibana for your
web_trafficindex, using@timestampas the time field. -
Go to Discover in Kibana and select your
web_trafficdata view. Change the time picker to be from April 1 to April 30, 2021. You should see the count of all the documents in the date histogram: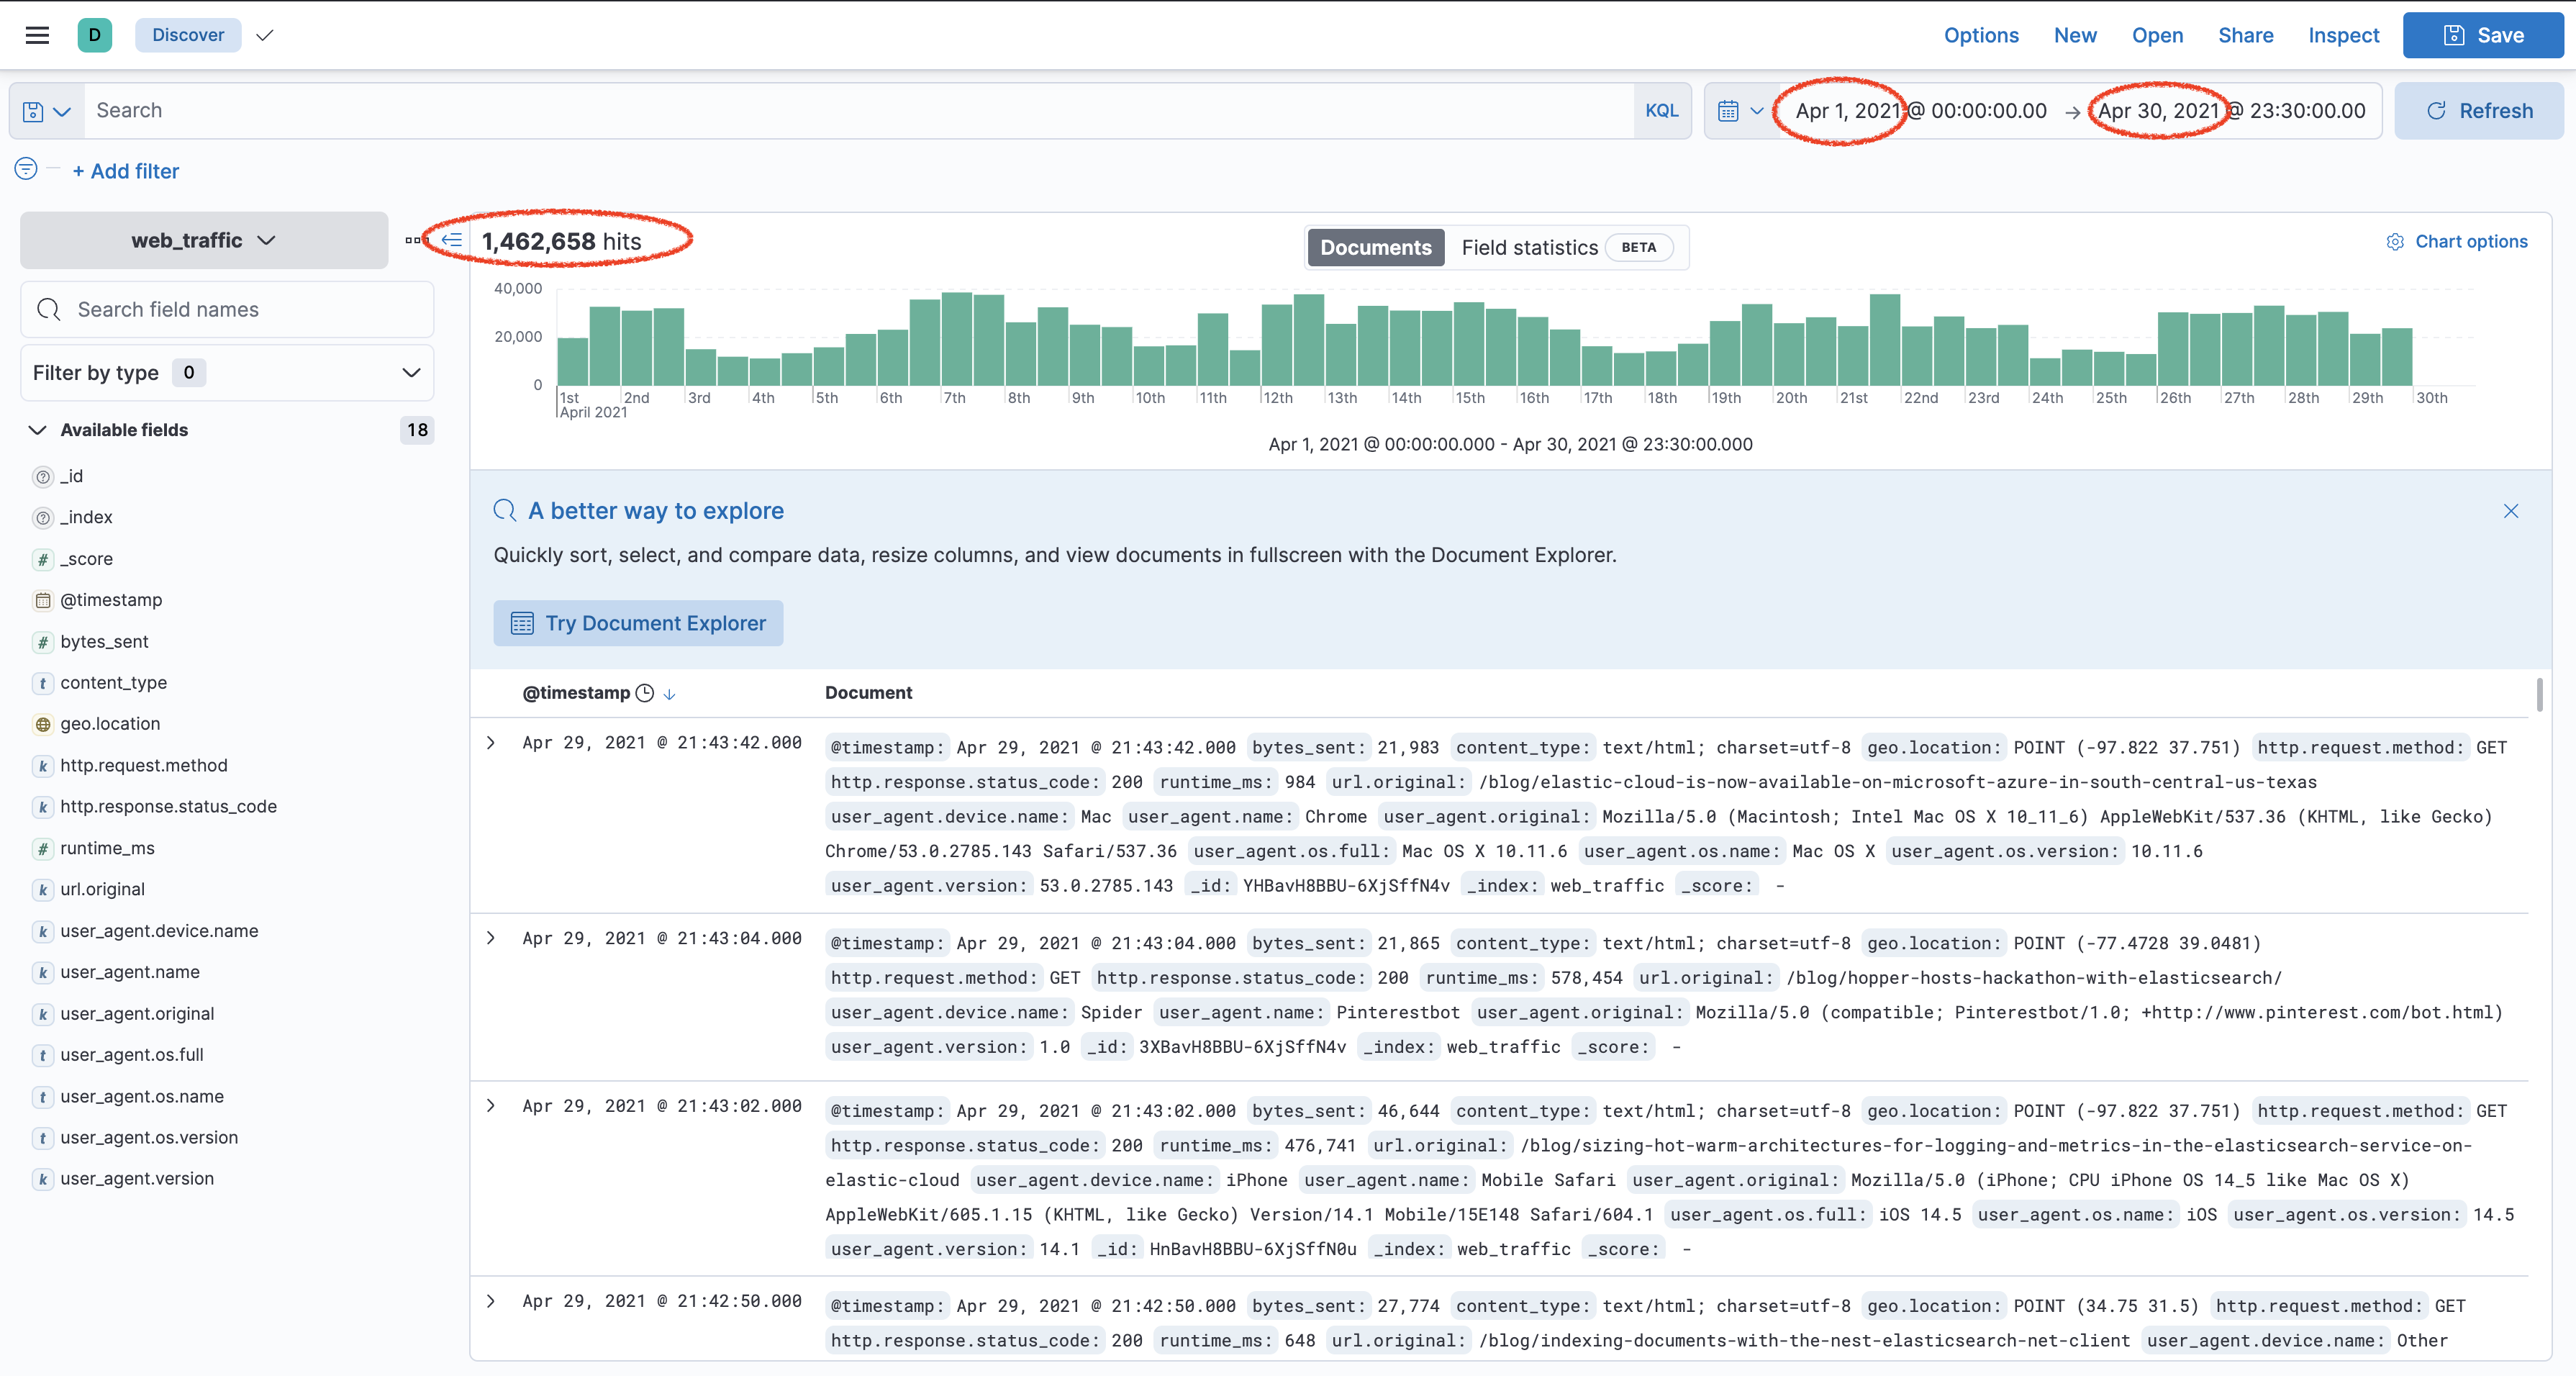
Summary:
In this lab, you reindexed documents from a remote cluster using the Reindex API. You saw how to use _delete_by_query. You also created an ingest node pipeline to transform log data and created an index with a default pipeline. You now have a new index called web_traffic that contains log data of visitors to our blogs' website.